


Analyzing team passing networks depending on the possession outcome
Using network science to analyze football data from a new perspective, capturing aspects of the game that traditional statistics cannot

Working alongside Marc Estévez, and with the guidance of our tutors Javier M. Buldú and Sergi Nadal, we explored the application of network science to football analysis as our Final Project for the Postgraduate in Sports Analytics by FC Barcelona and UPC School.
Introduction
Football is a complex system that involves multiple agents interacting with each other under uncertain and dynamic conditions, making it challenging to analyze and understand using traditional statistical methods. We propose using network science, an interdisciplinary field that studies complex systems as networks or graphs, to model and analyze team dynamics, strategies, and performance in football. Network science can reveal aspects of the game that are not easily observable or quantifiable by traditional statistics and can consider different levels of granularity and complexity of the game, such as its dynamics, space, time, and multilayer nature. We also review the current state of the field and some articles that apply network analysis methods to study the passing networks of football teams at different levels of granularity and complexity. Finally, we propose a new research project that aims to extend the existing work by incorporating a different approach and defining different networks based on how the possession ended.
Related Work
In recent years, network science has emerged as a powerful tool to analyze sports data, especially football. Traditional statistics based on individual performance or aggregated team measures may not capture the richness and complexity of the game. Network science offers a new perspective to study football by representing teams as passing networks.
Several studies have used network science to analyze football passing networks at different levels of granularity and abstraction. Some studies have focused on player passing networks, where nodes are players and links are weighted by the number of passes between them. These studies have investigated how network properties such as centrality, clustering, efficiency, modularity, and assortativity relate to team performance indicators such as ball possession, shots on goal, goals scored or conceded.

Other studies have considered pitch passing networks, where nodes are specific regions of the field connected through passes made by players occupying them. These studies have explored how spatial patterns of passing vary across teams, positions, and match situations, and how they affect team outcomes such as scoring opportunities, defensive pressure, or territorial dominance.

A third type of passing network is the pitch-player passing network, where nodes are a combination of a player and its position at the moment of the pass. These studies have examined how players move and distribute themselves on the pitch, and how their spatial positioning influences their passing behavior and network role. In addition to these three types of passing networks, some studies have also incorporated other dimensions such as time and layers to capture the dynamic and multilayer nature of football passing networks.

Buldú et al. (2018) proposed a framework to analyze football passing networks along four dimensions: dynamics, space, time, and layers. To do so, we construct different types of networks based on passes between players or regions of the pitch, and compute various network metrics to characterize their structure and evolution. They applied this framework to study one season of the Spanish national league and compared different teams based on their network signatures.
One of the teams that stood out to these researchers was F.C. Barcelona coached by Pep Guardiola, which has been considered one of the best teams in football history. Buldú et al. (2019) further investigated this team and used data from 38 matches of the Spanish national league (La Liga) in the season 2008–2009, where Barcelona won with a record-breaking score of 99 points out of 114 possible. By using network science, this research paper identified several features that characterized its style of play: high connectivity, clustering, entropy, centrality diversity, spatial diversity, temporal diversity, and high layer diversity and short distances and low modularity.
There are multiple types of information that can be extracted from network science applied in football, including the connectivity and cooperation among players, the cohesion and coordination among players, the structure and hierarchy of the team, the style and speed of play, and the homogeneity and integration of the team. These metrics are crucial in understanding the complex interplay between players and how it affects team performance.
Problem Statement
The problem statement of the research project focuses on the application of network science in sports analytics, particularly in football. In football there are three different types of networks that correspond to three different situations that can occur during a possession in football. These situations are (A) when the team keeps the ball even though the sequence finished (e.g. a foul or corner kick), (B) when the action ends up in a shot, and (C) when the team loses the control of the ball. The main focus of the project is to investigate whether there are players who participate more in actions that end up in shots and some that participate more in actions where their team loses the ball.
To achieve this objective, the we used event datasets of football matches from a whole season to construct and analyze team passing networks. We also applied a series of network metrics to understand how different teams organize their passing networks and to identify one or more key players. Moreover, we examined how the passing networks change their structure depending on the final result of the action, and compared it to the complete network with all the passes in a match.
Data
Data Description
The data used in this study consists of four different files for each of the 462 matches played in the season 2021/2022 from LaLiga Smartbank and was extracted from Opta.

The data is divided into four groups of files: (1) team identifiers and names, (2) player information, (3) pass information, and (4) shot information. The second group of files contains information about the players, such as player identifier, name, team, position, and minutes played. The third group of files contains information about passes made in each match, including the match and team identifiers, pass outcome, origin and destination positions, and possession and sequence numbers. The fourth group of files contains information about shots, including match and team identifiers, expected goal probability, player and goalkeeper information, and shot location. On average, there were over 897 passes and 24 shots per match in the season observed.
Data Management
In this section of the research project report, the focus is on data management. The goal is to analyze how teams pass the ball between players and identify any key players based on pass sequences and outcomes. All the passes made in a match are collected and the team in possession of the ball is added along with the names of the players involved in each pass.
Next, we did the same for the actions that ended with shots and with lost balls, which have on average almost 40 and 196 in each respective passing network.
In summary, from each match and team, three different networks were obtained with information about the passes, with the number of passes made and received by any pair of players. From these networks, it was computed the centrality values of the players and we obtained, for each player from each team and match, the number of passes done and received, their centrality values in the different networks, as well as the minutes and the position they played in.
Methodology
Basic networks concepts
A network is defined as a collection of vertices and edges, where the vertices represent the players from the team that played that match, and the edges connect two players if a pass was made between them during that match. We use directed networks, where the edges are made of ordered pairs of vertices with an initial and a destination vertex, representing the player who gives the pass and the ball receiver. We assign weights to the edges showing the number of passes given from one player to the other. We depict these networks using adjacency matrices, where the elements of the matrix represent the weight of the edge between two players.
Our aim was to analyze these networks to identify the players who contribute more in the offensive phases by making more passes, and how the teams distribute the passes they make between their players. This methodology allows for a detailed analysis of team performance when in possession of the ball, which can provide valuable insights for improving team strategies and player selection.
If you want to learn more about passing networks, check put this article where I show a paper with 4 different kinds of networks using tracking data:
Tracking Networks: A New Approach to Understanding Player and Team Performance
Explore How New Tracking Networks are Revolutionizing Player and Team Analysis in Football (Soccer)medium.com
Eigenvector centrality
In this section, the report describes the use of eigenvector centrality to extract relevant information about the importance of players in passing networks. Eigenvector centrality is calculated for each player in the passing networks by computing the i-th element of the eigenvector v in Av = λv, where A is the adjacency matrix and λ is the largest eigenvalue of A. This metric allows the analysis of the relevance of each player in the passing network, indicating which ones are more central and which ones take less part in the construction of plays. The calculation of eigenvector centralities is performed using the eigenvector_centrality function from the NetworkX library in Python.
The report analyzes how the centralities of the players from all the teams are distributed and which players were the most relevant for each type of network. Furthermore, the difference between the centralities in the passing networks that end in a shot and the ones that end in a lost ball is calculated to identify players that have more impact in positive plays than in passes whose outcome is negative for the team. The report also measures the heterogeneity of the total passing networks from the teams by computing the standard deviations of the centralities of their players. Finally, an example of a passing network with a very relevant player and another without any notable performance is shown. These analyses provide valuable insights into the contribution of individual players in passing networks and their impact on team performance.
Results
In this research project, we analyzed the passing networks of the teams in the LaLiga Smartbank 2021/2022 season using the eigenvector centrality metric. The eigenvector centrality was calculated for each player in the different passing networks using the adjacency matrix and the largest eigenvalue of the matrix. This metric measures the influence of a player in the network considering the importance of its neighboring nodes. We analyzed the distribution of the centralities of the players in the passing networks, identifying the most relevant players in each type of network (total passes, sequences of passes that end in a shot, and the ones in the ball being lost) and for the difference between Shot centrality and Lost centrality. We also studied the heterogeneity of the total passing networks of the different teams by analyzing the variability of their players’ centralities. Finally, we presented two examples of passing networks, one containing a highly relevant player and the other with a more homogeneous distribution of player importance. These results provide valuable insights into the performance of the teams and players, highlighting the players that had the most impact in the construction of plays and identifying the teams with more homogeneous or heterogeneous passing networks.
Players Performance
Centralities distributions and top performances in a match
In this section of the report, we analyzed the performance of football players in passing networks, with a focus on eigenvector centralities. To identify the common values and the outstanding ones, we compared the centralities of outfield players who had played the whole match for each of the three types of networks, namely total passes, lost passes, and passes leading to shots. We found that the distributions of centralities from the total passes and lost passes networks were similar, while the distribution of centralities from the passes leading to shots network had a different pattern, with more small and high values. This implies that there are more players who are not involved in sequences of passes that end in a shot, and more players who are relevant in such plays.

With this first approach of only selecting players that completed the full game, we get a big issue. We lose most of the data since nowadays with 5 substitutions only 5 outfield players tend to play the 90 minutes, and normally midfielders and attacking players tend to be substituted more often than defenders. To address the issue of losing centrality values of relevant players who did not play the whole match, we considered the centralities of all players, except goalkeepers, who played at least 360 minutes (4 whole matches) with their team. In this case, it was found that the distributions of centralities in the different networks were similar to the previous approach but with more lower centralities, which were previously being removed.
Furthermore, we analyzed the top performances of players in the different networks and found that the top players in the total passes and lost passes networks were different from those in the passes leading to shots network. This implies that players’ roles in the passing networks vary depending on the type of network.


Overall, this analysis provides insights into the performance of players in passing networks and can be used to understand their roles and identify top performers in different situations.
Top average performances
In this section, we analyze the top performers of the season based on the average eigenvector centrality of the players. The analysis is done for all three networks: All, Lost, and Shot. The top 10 players are selected for each network based on their average eigenvector centrality, and they must have played at least 360 minutes during the season for their team. We also look at the standard deviation to assess the consistency of each player.
The results show that the All Network and Lost Network are quite similar, while the Shot Network is quite different. The top players in the first two cases have mean values between 0.4 and a bit under 0.5, with shorter standard deviations than in the Shot Network case. In terms of player positions, the All and Lost networks mostly have defenders, while the Shot network has more strikers and midfielders.


We note that some teams tend to appear more frequently in the top rankings, with Sporting de Gijón having the top 2 players in the All and Lost networks, and Real Sociedad B appearing multiple times in all three networks. Girona, Huesca, Las Palmas, and Cartagena also appear multiple times in the rankings. It is interesting to note that Almería does not appear in the first two plots but has 2 players in the top 10 of the Lost network.
Overall, this analysis provides insights into the performance of players over the course of the season and how it varies across different network types. The findings could be useful for coaches and analysts in understanding the importance and consistency of individual players on their teams.
Top average performances: Shot vs Lost networks
This section of the report focuses on analyzing the involvement of players in plays that result in shots versus plays where the ball is lost to the opponent. The aim of this analysis was to identify players who were more important in shot plays and those who were more involved in lost actions. The analysis revealed that there were players who were in fact more involved in shot plays than in the ones where the team loses the ball. On the other hand, there were also players who participated more in lost actions than in shot actions.
The analysis further ranked the top 10 and bottom 10 players based on the difference in the eigenvector centrality mean in the Shot Network versus the Lost Network. The top 10 players were found to be strikers or players that played both as strikers and midfielders, while all of the players in the bottom 10 were defenders. This finding was quite expected as strikers and midfielders are generally more involved in attacking plays that result in shots, while defenders are more focused on defensive actions and build-up sequences thay may lead to the loss of the ball.

It is worth noting that the teams and players that appear in this plot vary from the other top 10s from the Lost and Shot networks, which suggests that these two networks are quite different. Overall, this analysis provides valuable insights into the involvement of players in different types of plays and highlights the importance of strikers and midfielders in attacking plays resulting in shots.
Teams passing networks homogeneity
In this section, we analyze the homogeneity of passing networks from a team perspective by computing the standard deviation of the eigenvector centrality values of all the outfield players in all matches for each team. Again goalkeepers are excluded from their analysis to focus only on the difference of homogeneities between the outfield players of teams. We also compare the homogeneity of passing networks of teams with the maximum average centrality value from players to see how having a key player affects the centrality values of other players. We found that teams with more relevant players in the passing networks tend to have more variability between the centrality values of their players, and the networks are more heterogeneous. On the other hand, teams without any really relevant player distribute passes more homogeneously among players. We also provide a scatterplot and regression line to show the relationship between maximum average centrality and centrality standard deviation by team. The scatterplot reveals that teams with more relevant players tend to have more heterogeneous passing networks. We see examples of teams with these characteristics, such as Real Sociedad B, Sporting de Gijón, Girona, Eibar, Ponferradina, Amorebieta, Lugo, Burgos CF, Real Oviedo, and Las Palmas.

Passing networks from two matches
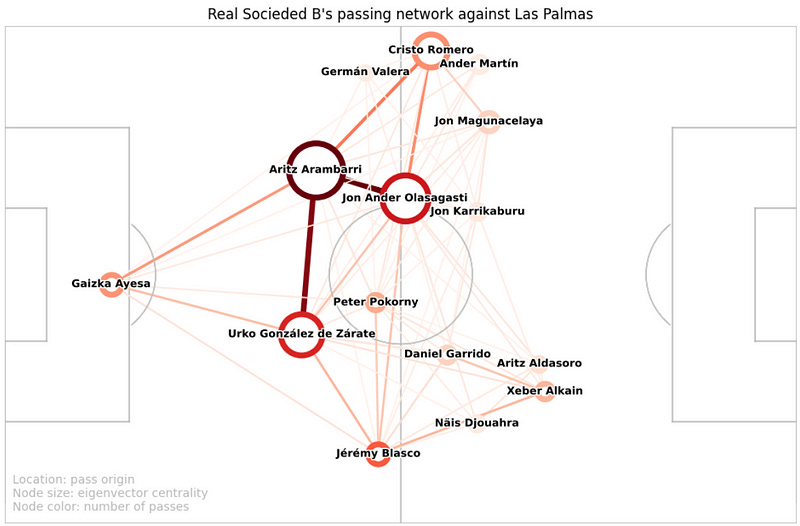
In this section, we present two passing networks from different matches to demonstrate the variability in passing network structures. The passing networks were generated using the code obtained from https://github.com/Friends-of-Tracking-Data-FoTD/passing-networks-in-python. The first passing network, represented in Figure 6, is from the Real Sociedad B match, where there was a player with the highest eigenvector centrality. The size of the nodes in the network represents the value of the eigenvector centrality of the player, while the color of the nodes represents the number of passes that the player has given. The color and size of the edges indicate the number of passes made between the players. The network demonstrates that the most central players in the Real Sociedad B network are the defenders and one midfielder. Aritz Arambarri, who is one of the players with higher average eigenvector centrality in the whole competition, had the highest centrality in this match.
The second passing network, represented in Figure 7, is from the Real Zaragoza match, where there was not any prominent key player, and the passes were more evenly distributed between all the players. The network shows that there are not many differences between the centrality values of the players that started the game, and more players were actively involved in the passing network. Again, the higher eigenvector centralities belong to the defenders, but in this case, a midfielder in more advanced positions also played an important role. The passing network also shows that more passes were made in the sidelines than in more centered positions, where the midfielders that were closer to the defenders participated less in the passes.

Discussion and Future Work
In the discussion and future work section, we describe the approach to analyzing passing networks in football matches. We first focused on the centrality of players who played the whole match, but found that this limited the analysis to mostly defenders. Therefore, we only included players who played at least 360 minutes for their team to capture the contributions of players with lower playing time.
It was observed that the Shot Networks tended to have fewer passes and be more polarized than the All and Lost Networks, with strikers and offensive midfielders featuring more in the former. We also found that some teams distributed passes more evenly among players, while others focused more on one or two players, who tended to have high eigenvector centralities.
One limitation of the analysis is that the algorithm used to compute the eigenvector centrality places more importance on the receiving player than the passing player in directed networks, which can lead to unexpected results in short possessions. The shooter, in particular, can act as a sink for centrality if there are few passes leading up to the shot. To address this issue, we suggest adding a new connection between the last receiver and last passer in the opposite direction to ensure the last node is more connected.
Moving forward, we suggest clustering teams based on how homogeneous or heterogeneous they are in their passing networks, to identify which teams rely on a single player versus those that distribute passes more evenly. We also propose a future study that focuses on the role of goalkeepers in a team’s matches.


