Can Football Players Be Measured on Their Decision Making?
Quantifying pass risks and gains with Expected Possession Value to analyze players’ decision-making abilities.

Introduction
The last decade has witnessed a transformative phase in football analytics, driven by enhanced data accessibility and advancements in analytical methodologies. These developments have deepened insights into player performance, tactical strategies, and innovative Key Performance Indicators (KPIs). Football datasets are classified into three main categories: basic statistics, event data, and tracking data, each offering unique insights into the game. Basic statistics, publicly available, capture general match descriptors such as goals, passes, and possession percentages. Event datasets go deeper by documenting every on-ball action, including its temporal context, location, and outcome. These datasets enable advanced metrics like expected Goals (xG), which estimates the probability of a shot resulting in a goal, and Valuing Actions by Estimating Probabilities (VAEP), which quantifies the likelihood of an action leading to a goal or concession. Event datasets also facilitate constructing passing networks to analyze team organization and movement patterns.
Tracking datasets provide the most granular view, capturing the precise locations of all players and the ball at high spatial and temporal resolutions. This information enables off-ball metrics such as pitch control models, which define territorial dominance, and analyses of player movement coordination during various match phases. Additionally, tracking data allows the development of "tracking networks," focusing on defensive marking and player coordination.
A hybrid dataset, StatsBomb 360º, integrates event and tracking data by adding the spatial positions of all players visible in the frame for each event. This innovation facilitates the study of off-ball behavior, enabling advanced metrics that account for player positioning. This paper leverages StatsBomb 360º datasets to explore player decision-making in passing, focusing on evaluating risk and reward through the Expected Possession Value (EPV). By quantifying pass outcomes and potential alternatives, the study introduces two decision parameters (DPs): one measuring risk (rDP) and another gauging gain (gDP). These metrics reveal whether players prioritize safe passes or opt for riskier decisions with higher potential rewards. Moreover, the analysis investigates decision-making patterns across field regions and match phases, advancing understanding of tactical choices in football.
Materials and Methods
Datasets
The study utilizes 37 matches played by F.C. Barcelona during the 2020/2021 La Liga season, sourced from StatsBomb 360º datasets. These datasets combine event and tracking data, providing the Euclidean positions of all players visible in each frame for every event. However, the datasets come with limitations, including missing player locations for those outside the camera’s view. For each pass event, the datasets include starting and ending coordinates, the identities of the passer and receiver, and the positions of nearby players.

To analyze passing behavior, only passes made during regular play are considered, excluding throw-ins, corners, and fouls. Additionally, only completed passes are analyzed to ensure both starting and ending locations are available. The study focuses on players with more than 100 passes, resulting in an analysis of 8,822 passes across 20 players. Each pass is represented with its starting and ending coordinates, the surrounding player positions, and other contextual information.
The Model
The study adopts a modeling framework balancing complexity and interpretability. The goal is to evaluate passes by assessing both the risk of losing possession and the value gained. The model consists of three core components: intercepting a pass, valuing passes, and quantifying decision-making.
Intercepting a Pass
The model identifies pitch regions where a pass can avoid interception. It evaluates interception probability based on player speed, distance to the ball’s trajectory, and ball movement dynamics. Using a logistic distribution, the probability of a rival intercepting the ball is computed for each region along the ball's path. For completed passes, starting and ending regions are determined, while for alternative passes, all pitch regions are considered as potential endpoints, significantly increasing computation time.
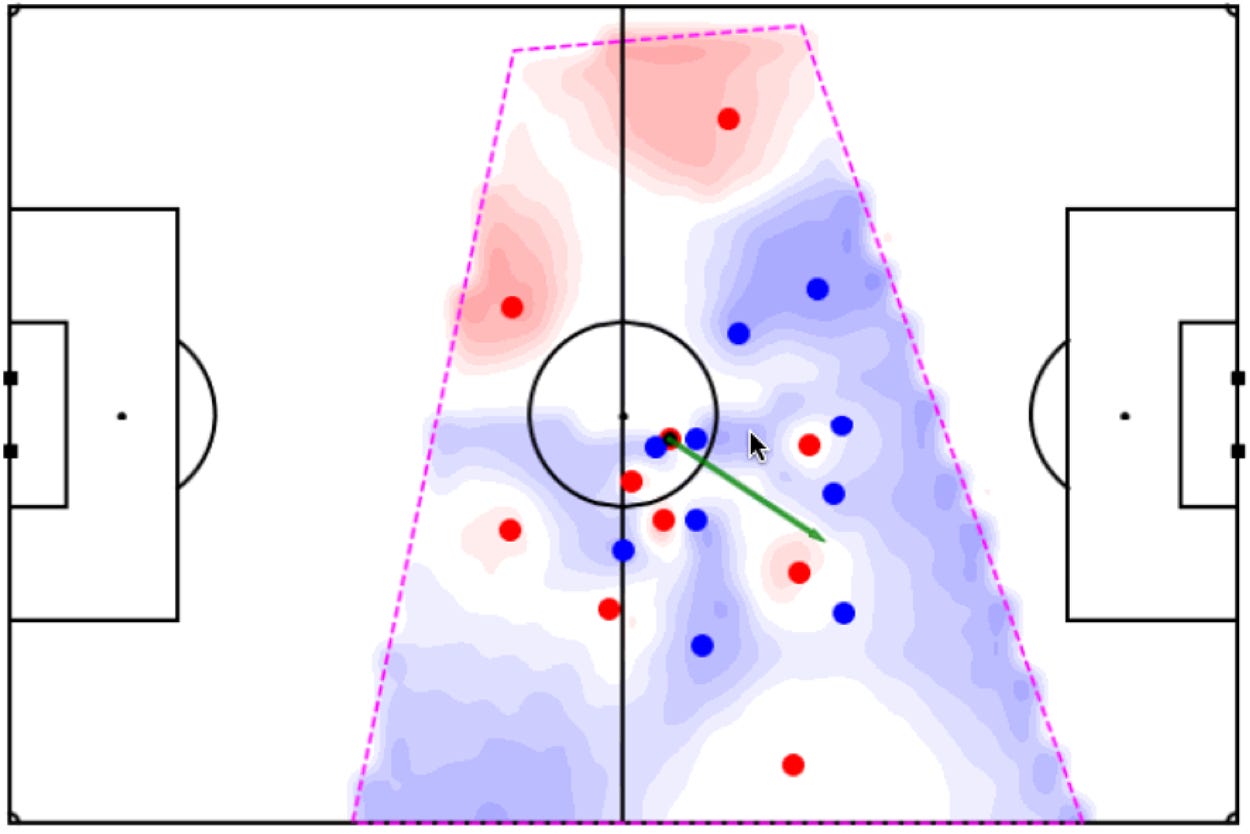
An interception parameter (I) is calculated as the aggregated probability of interception across all rival players, resulting in a matrix indicating interception likelihood for any pitch region. Similarly, a possession parameter (P) is derived for teammates, estimating the likelihood of maintaining possession. The risk parameter (R) is defined as the difference between interception and possession probabilities, with values ranging from -1 to 1. A high positive R indicates high interception risk, while a low negative R suggests a high probability of possession retention.
Valuing Passes
Pass value is quantified using the Expected Possession Value (EPV), which estimates the likelihood of a specific location leading to a scoring opportunity based on historical event data. EPV changes are calculated as the difference between the EPV at the pass endpoint and its origin. This increment (ΔEPV) serves as a metric for the gain associated with a pass.
Quantifying Decision-Making
To evaluate decision-making, two Decision Parameters (DPs) are defined. The risk Decision Parameter (rDP) measures the percentage of passes directed to the teammate with the lowest risk. The gain Decision Parameter (gDP) calculates the percentage of passes aimed at the teammate offering the highest possession value increase. These parameters are calculated not only for actual passes but also for all potential passes to assess a player’s ability to optimize risk and gain in their decisions.
Limitations
The model has several limitations. Data constraints include missing player velocities, body orientations, and locations outside the camera frame, reducing the accuracy of interception probability estimates. High passes and variable ball speeds are not accounted for, and the EPV matrix is not team-specific, which may affect precision. Furthermore, defining the “optimal” pass remains subjective, as the weight given to risk and gain varies across field regions and match contexts. Future enhancements could incorporate additional contextual variables and broader datasets, improving the robustness and applicability of the model.
Results
Overview of Risk and Gain in Passes
The study first examines the interplay between the risk parameter (r) and the increment of Expected Possession Value (ΔEPV) for F.C. Barcelona’s completed passes in their 5–2 match against Getafe during the 2020/2021 season. A large cluster of passes hovers around zero ΔEPV, reflecting minimal direct increases in possession value. However, most of these passes fall below the zero-risk line, indicating a higher likelihood of completion than interception. Four distinct regions emerge:
High-risk, high-gain passes, primarily responsible for creating dangerous opportunities.
Low-risk, high-gain passes, the rare optimal actions.
Low-risk, low-gain passes, aimed at maintaining possession without progression.
High-risk, low-gain passes, undesirable actions to be avoided.

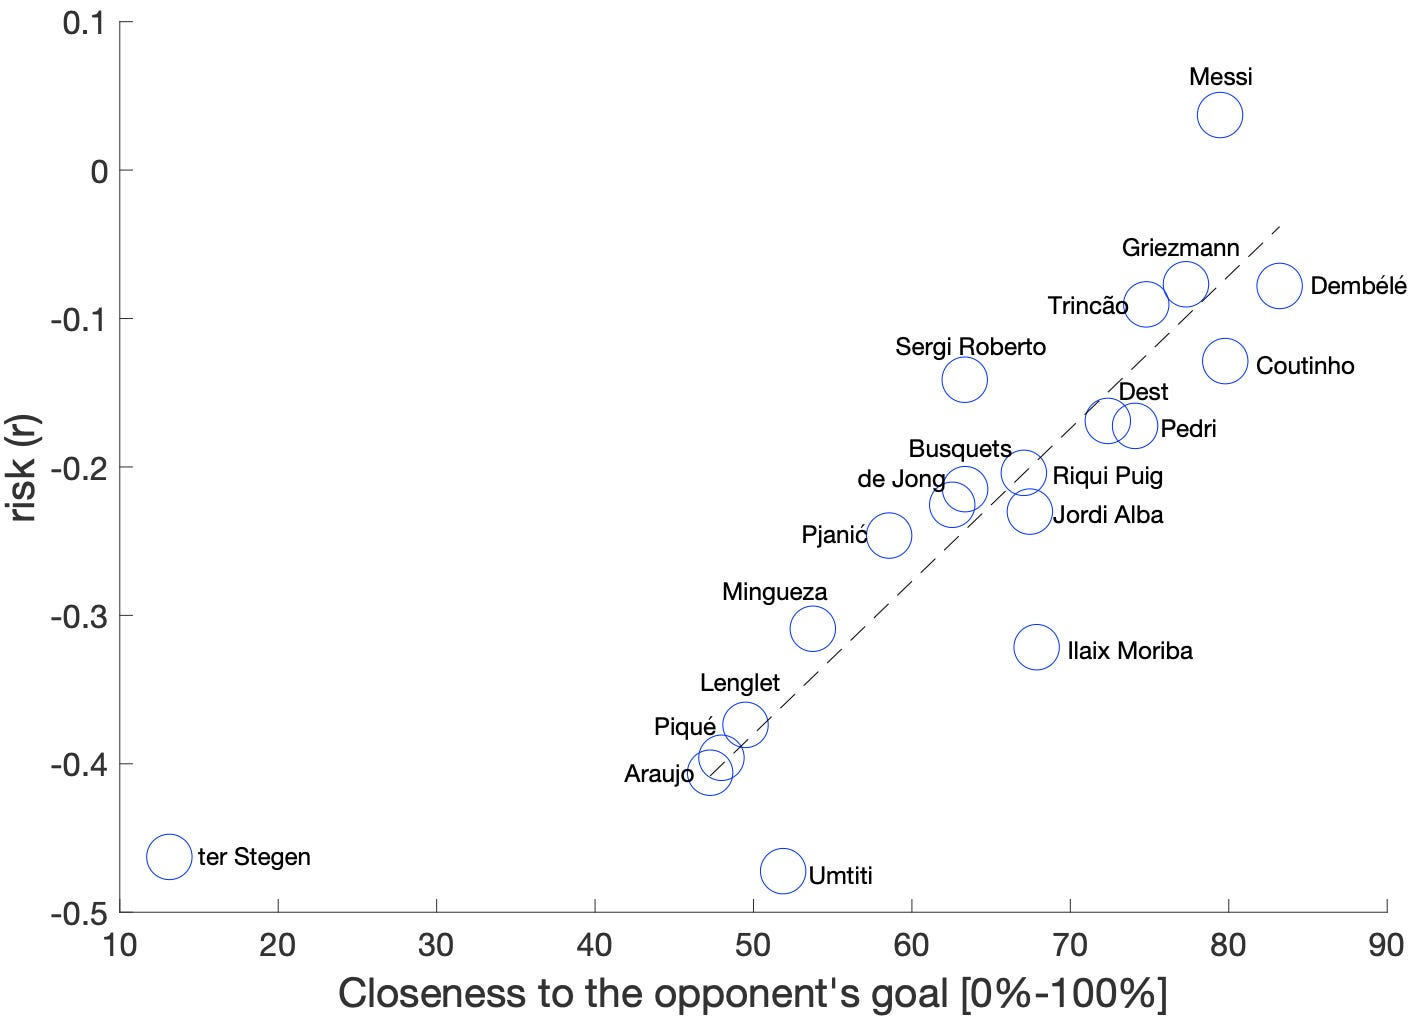
Risk Distribution by Player
The average risk assumed by players correlates strongly with their proximity to the opponent’s goal (R^2=0.754). Messi shows the highest average risk among Barcelona players, reflecting his ability to successfully execute high-risk passes. Conversely, defenders such as Umtiti exhibit the lowest risk values, consistent with their conservative role. The clustering of forward players at higher risk levels and defenders at lower ones aligns with expected tactical roles.
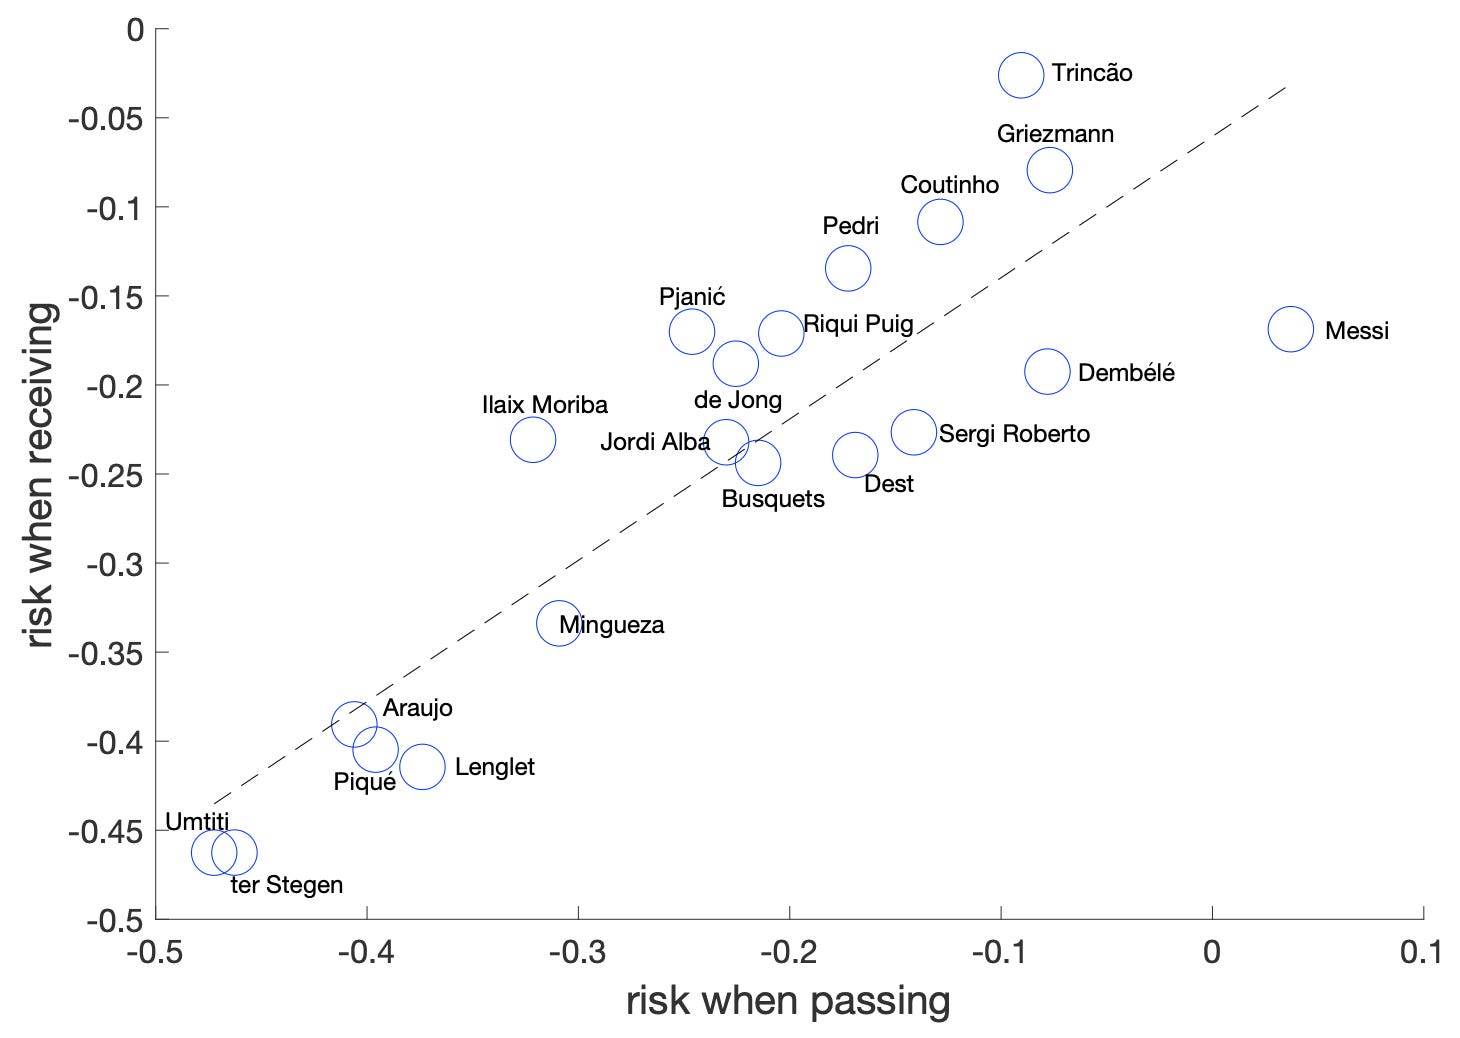
The study also differentiates between risk when passing (r_send) and risk when receiving (r_receive), revealing a positive correlation (R^2=0.754). While Messi assumes high risk when passing, his receiving risk is comparatively lower. Trincão, however, frequently receives high-risk passes, indicating his positioning in challenging scenarios. Defenders and the goalkeeper exhibit the lowest receiving risks
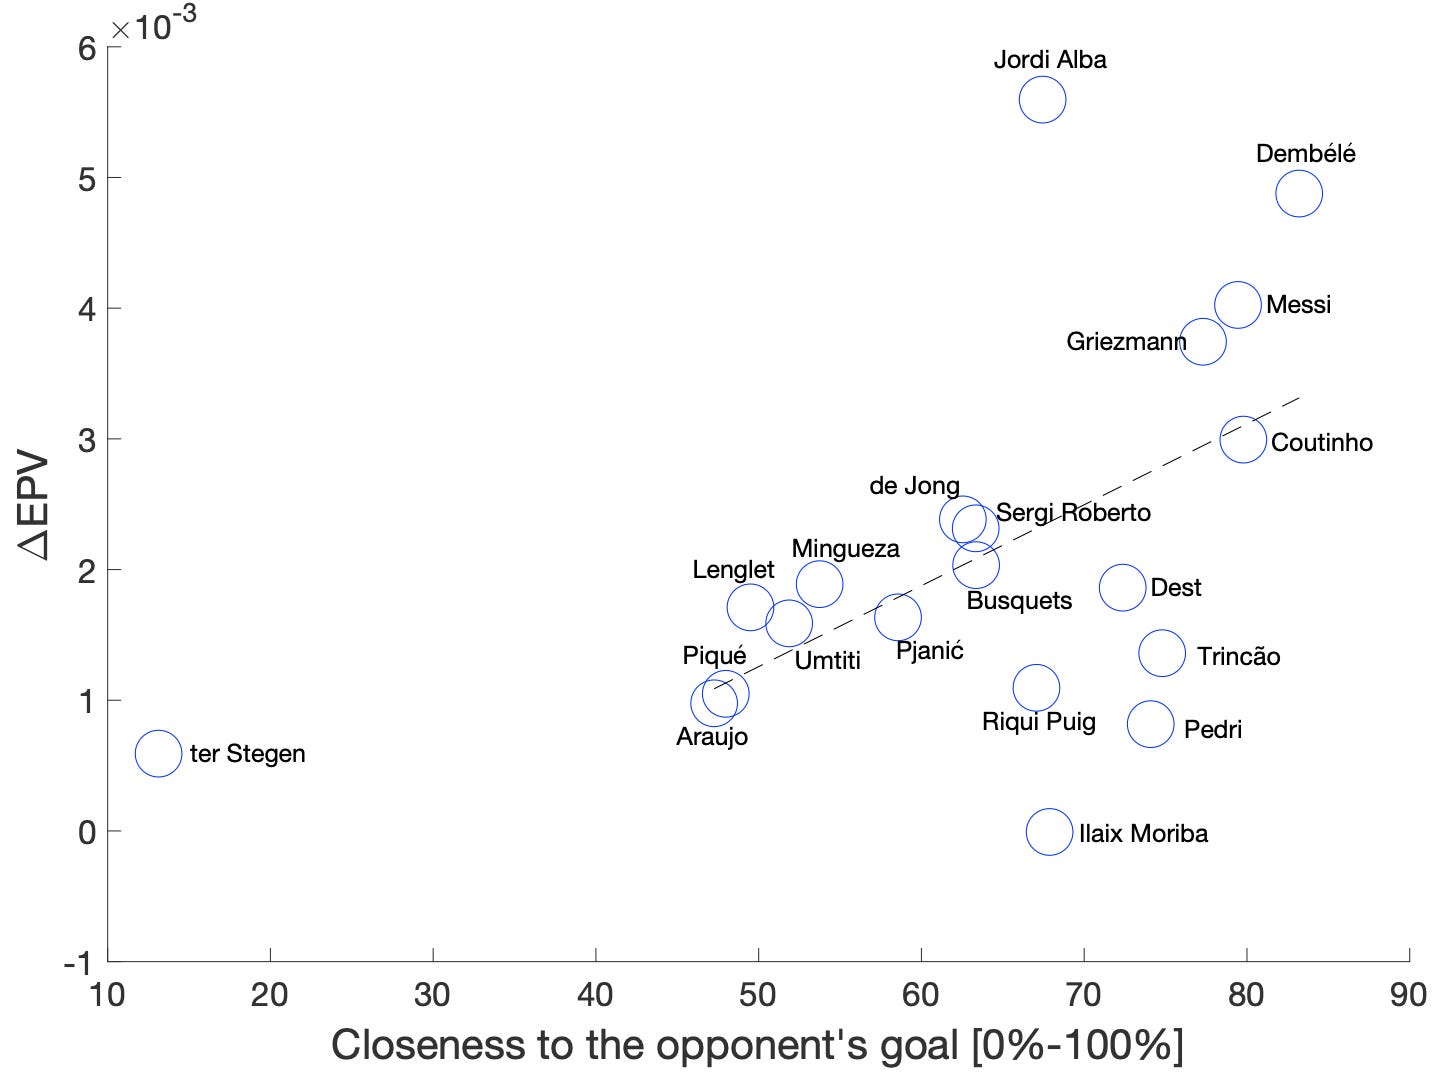
Increment of Possession Value by Player
Players' average ΔEPV correlates modestly with their pass proximity to the opponent’s goal (R^2=0.239). Jordi Alba achieves the highest average ΔEPV, despite playing in a less advanced position compared to forwards. This highlights his effectiveness in creating high-value opportunities through progressive passes. Ilaix Moriba shows the lowest ΔEPV, reflecting his focus on safer passes
Decision-Making Parameters
The risk Decision Parameter (rDP) evaluates players’ tendencies to pass to the teammate with the lowest risk. Messi, Riqui Puig, and Busquets exhibit low rDP values, indicating a preference for high-risk options. In contrast, players like Dest, Moriba, and Trincão display higher rDPs, opting for safer passes in over 45% of cases. Defenders form a moderate rDP cluster, balancing risk-averse passing with tactical responsibility.

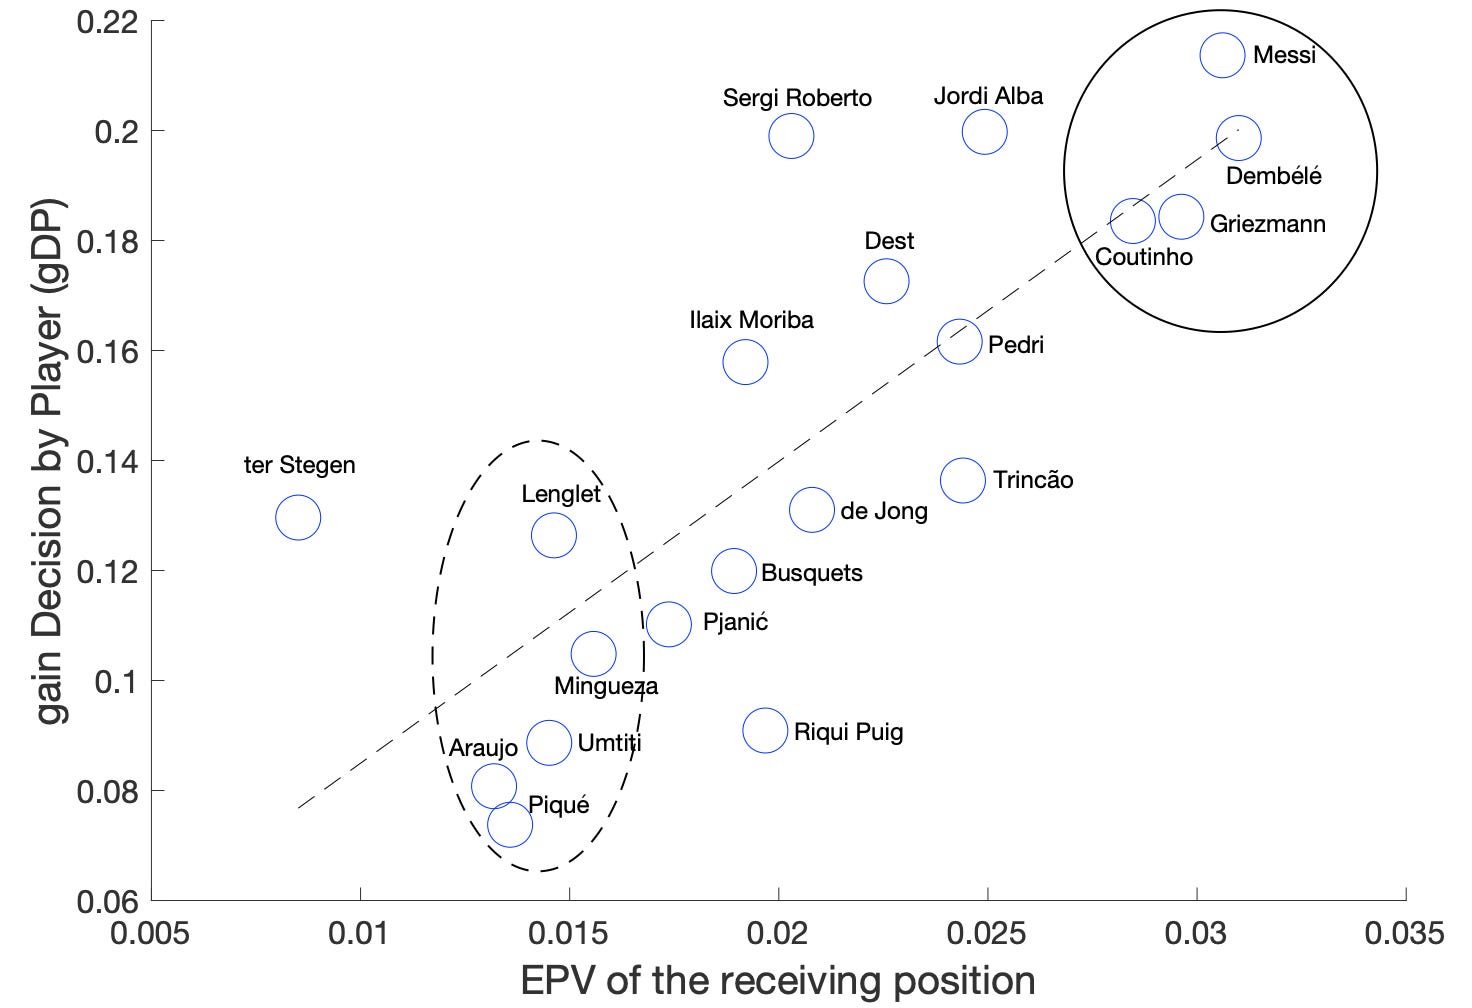
The gain Decision Parameter (gDP) measures the frequency of passes to teammates positioned in regions with the highest ΔEPV and negative risk values. Messi leads the ranking (gDP=0.22), with 22% of his passes directed to high-value locations. Forwards dominate the top gDP rankings, while defenders, including Piqué and Araújo, occupy lower positions. Interestingly, defenders with similar receiving EPV values exhibit varying gDPs, indicating differing tendencies to seek high-gain passes.
Spatial and Temporal Analysis
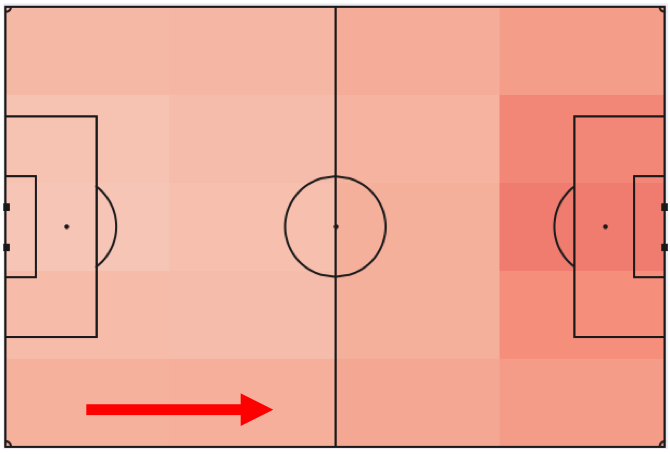
Spatially, interception probability peaks near the opponent’s goal, with additional risks observed along the flanks in defensive zones. These insights can guide tactical decisions to exploit or mitigate high-risk regions.
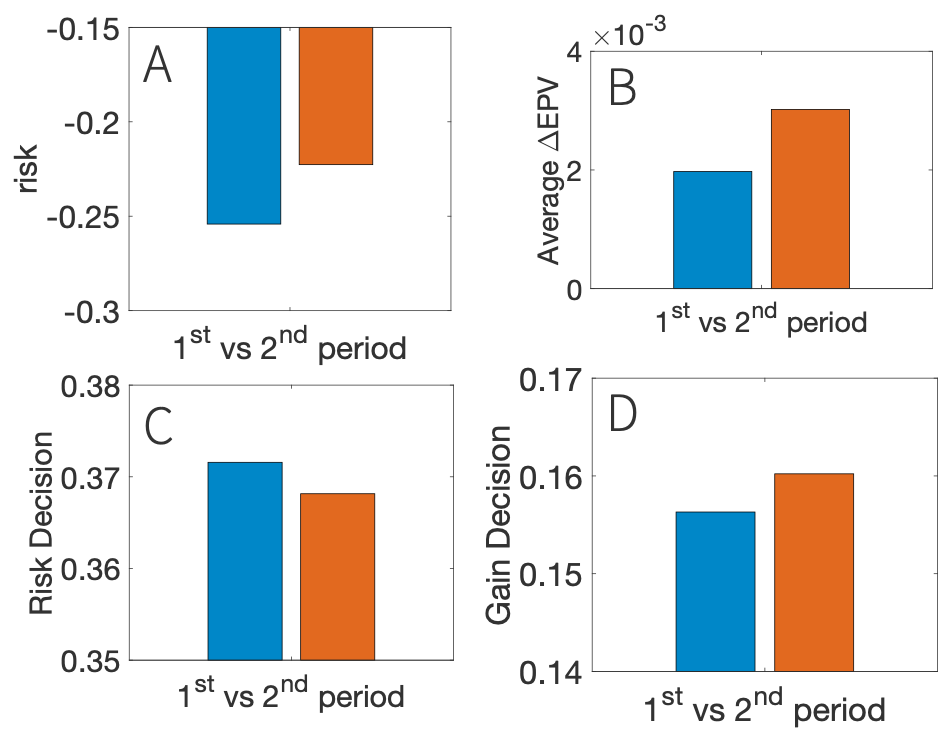
Temporally, players assume more risk and target higher ΔEPV passes in the second half of matches. This is reflected in increased average risk (r) and ΔEPV values, alongside a decrease in rDP and a rise in gDP. This suggests players prioritize value creation over risk aversion as matches progress.
Discussion
The paper presents a novel methodology to evaluate football players’ decision-making during passing by analyzing the trade-off between risk and gain, quantified using the Expected Possession Value (EPV). By comparing the assumed risk and resulting gain, players are categorized based on their passing strategies: those favoring safer passes with lower gains versus those taking higher risks for potentially better outcomes. Furthermore, the analysis explores when (e.g., first versus second half) and where (specific pitch regions) these decisions occur.
Decision-Making Parameters
Two new decision-making metrics, the risk Decision Parameter (rDP) and gain Decision Parameter (gDP), are introduced. These metrics evaluate whether players choose passes minimizing risk or maximizing gain, respectively. Calculations extend beyond observed passes to include potential alternatives based on teammates’ and opponents’ locations and movements, enabling identification of optimal passes. This framework provides a structured way to measure passing quality, contextualizing decisions based on risk and gain.
Model Flexibility and Limitations
The model emphasizes risk and gain prioritization but acknowledges that defining the "optimal" pass depends on context. For example, in defensive zones, minimizing risk is often prioritized, whereas in attacking zones, maximizing gain may take precedence regardless of risk. Temporal factors, such as the match score or time remaining, also influence optimal decision-making, suggesting the need for context-sensitive weighting of risks and gains.
The model’s limitations are primarily due to data constraints. The incomplete positional data from StatsBomb 360° datasets and the absence of velocity and body orientation reduce the accuracy of interception probabilities. Additionally, the lack of high-pass modeling, variable ball speeds, and the computational trade-off in simplifying these aspects limit the model’s depth. Future versions could incorporate richer datasets, including full-field player positions and additional variables, to refine decision-making analysis.
Applications and Research Potential
This methodology represents an initial step toward analyzing decision-making using hybrid datasets. The findings demonstrate the feasibility of identifying player tendencies and assessing decision quality in different contexts. Extensions could include refining risk-gain balancing methods, integrating more sophisticated datasets, and exploring the influence of situational factors like pressure, scoreline, and match significance.
Overall, the proposed framework contributes to understanding player decision-making by providing a quantitative, context-aware foundation for analyzing passing strategies. It paves the way for further research into optimizing team tactics and individual player performance using advanced football analytics.
References
Burriel, B., & Buldú, J. M. (2021). The quest for the right pass: Quantifying player’s decision making. In Proceedings of the StatsBomb Innovation in Football Conference. StatsBomb, London, United Kingdom (pp. 1-22). https://statsbomb.com/wp-content/uploads/2021/11/Javier-M-Buldu.pdf
Learn More
My Recommended Books