Harnessing StatsBomb Data to Evaluate Counter-Pressing
Leveraging StatsBomb advanced data analytics to uncover the intricacies and impact of counter-pressing in modern football.
Introduction
This artcle published on StatsBomb by Will Morgan on 2018 discusses the growing prominence of pressing in football and its association with the success of teams such as Liverpool, Manchester City, Atlético Madrid, Tottenham Hotspur, and Napoli under the guidance of notable managers like Jürgen Klopp, Pep Guardiola, Diego Simeone, Mauricio Pochettino, and Maurizio Sarri. The rise of pressing has sparked interest in quantifying this tactical approach through various metrics.
Current Approaches and Challenges
The most notable and widely-used metric, ‘passes per defensive action’ (PPDA), pioneered by Colin Trainor, gained recognition within football clubs as an example of public analytics influencing the private domain of football analysis. Other metrics, such as possession-based approaches developed by Michael Caley, have also been utilized to evaluate pressing effectiveness. Furthermore, efforts have been made to quantify a team’s ability to disrupt pass completion, providing visual representations of pressing effectiveness through complex numerical modeling.
If you want to have a deeper dive into PPDA you can read my previous article:
However, the article highlights limitations in existing metrics, as they often focus on specific outcomes and overlook the diverse forms of pressing. Additionally, most metrics have been applied to a limited scope, with the Anfield Index team’s manual collection of Liverpool’s pressing over several seasons being an exception.
The section emphasizes the need for comprehensive and inclusive metrics that capture the various aspects and manifestations of pressing across different teams and playing styles. It highlights the challenges in quantifying pressing and calls for further research and development in this area. The ultimate goal is to provide a more nuanced understanding of pressing as a tactical approach and its impact on team performance.
Advancing the Study of Pressing
This section introduces the new pressure event data provided by StatsBomb Services, which revolutionized the analysis of pressing in football. The data captures instances when a player is within a five-yard radius of an opponent in possession, with the radius adjusted based on the potential impact of errors, such as goalkeepers facing higher pressure within a ten-yard range. In addition to recording the players involved and the location of the pressure event, the duration of the event is also documented.
The availability of this data presents an unprecedented opportunity to delve into the intricacies of pressing. Different teams employ various triggers to initiate their press, and now these triggers can be isolated and quantified. The efficiency and success of pressing can be assessed and separated from the overall pressing process at both the team and player levels. These tools enable enhanced team evaluation, scouting of opposition tactics, and player recruitment strategies.
By utilizing this new pressure event data, analysts and researchers can gain deeper insights into the effectiveness of pressing strategies. The ability to measure and quantify pressing in finer detail opens avenues for advanced statistical modeling, pattern recognition, and comparative analysis across teams and players. This data-driven approach not only enriches our understanding of pressing dynamics but also provides practical applications for evaluating team performance, formulating game plans against specific opponents, and identifying potential recruits who excel in applying effective pressure.
Analyzing Gegenpressing Strategies
This section explores the application of the new pressure data in analyzing gegenpressing or counter-pressing tactics, which involve a team immediately pressing the opposition after losing possession. The primary objective of counter-pressing is to disrupt the opponent’s counter-attack, particularly during the transition phase when the team is defensively vulnerable. The ideal outcome is to swiftly regain possession and exploit the opponent’s disorganized state to launch a quick attacking move. Typically, a five-second timeframe is used to define the period of intense pressure applied during counter-pressing.
The availability of StatsBomb’s new pressure data offers an exciting opportunity to directly observe and quantify counter-pressing actions. The data allows for the precise definition of counter-pressing as it occurs in coaching manuals, where pressure is applied to the opponent following a change in possession. Researchers can now determine the frequency of counter-pressing events and develop various metrics to assess the success or failure of this process. Moreover, the data enables the analysis of counter-pressing at the individual player level, a level of granularity that was previously inaccessible.
By leveraging this advanced pressure data, analysts can gain a deeper understanding of gegenpressing strategies. They can measure the effectiveness of counter-pressing, identify patterns, and evaluate the impact of specific players within the pressing system. This comprehensive analysis provides valuable insights into the tactical nuances and performance outcomes of gegenpressing, facilitating better strategic decision-making, player evaluation, and team optimization.
Analyzing the Geographical Patterns of Counter-Pressing
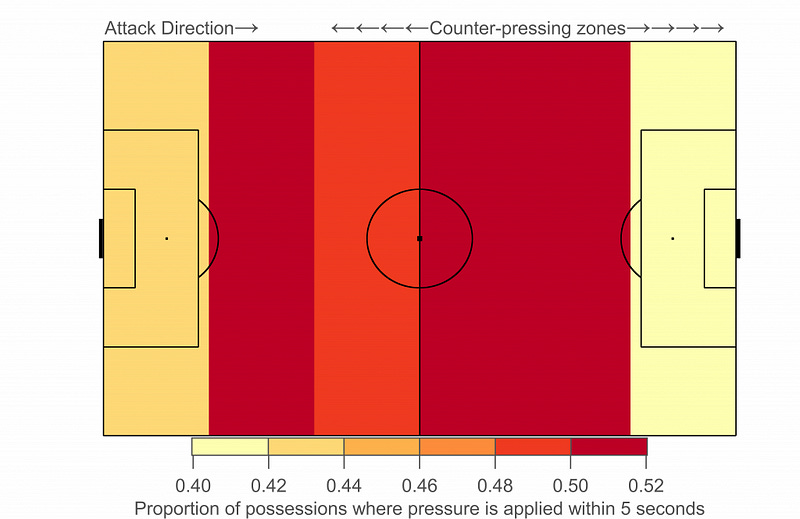
This section focuses on the geographical distribution of counter-pressing based on data from 177 Premier League matches in the past season. The pitch is divided into six horizontal zones, with the team out-of-possession playing from left-to-right. The color-coded representation on the pitch indicates the proportion of open-play possessions in each zone where pressure is applied within five seconds of a new possession.
The analysis reveals that counter-pressing is most commonly observed on possessions starting in the midfield zones, with a slightly higher occurrence in the opposition half. Possessions originating in the highest zone up the pitch experience less pressure, likely due to the lower player density in this area. Only a small fraction of possessions begin in the deepest zone, and a smaller proportion of those encounters quick counter-pressing compared to midfield possessions.
From a tactical standpoint, teams tend to reserve pressing for areas outside their own defensive third. While the exact boundary varies, this analysis specifically considers possessions starting higher up the pitch, as indicated by the counter-pressing line in the previous figure.
This spatial analysis provides valuable insights into the strategic deployment of counter-pressing by teams. It highlights the areas where teams are most proactive in applying pressure to disrupt the opponent’s possession and subsequent counter-attack. By understanding the geographical patterns of counter-pressing, coaches, analysts, and researchers can refine their tactical approaches, optimize pressing strategies, and identify potential vulnerabilities in the opponent’s buildup play.
Metrics and Observations
Next, the author examines the counter-pressing fraction, which represents the proportion of possessions in the counter-pressing zones where pressure is applied within five seconds. In the sample of Premier League matches from this season, approximately 47% of open-play possessions face immediate pressure. Notably, teams such as Manchester City, Tottenham Hotspur, and Liverpool, known for their managers’ emphasis on pressing, rank at the top of the counter-pressing rankings. Conversely, teams overseen by British managers, often associated with a deep-defensive approach, tend to rank lower.
The figure on the right reveals a strong correlation (0.86) between counter-pressing and possession in the aggregated sample. However, establishing causality is challenging due to the likely circular relationship between the two variables. Teams with higher possession rates may exhibit more energy to press intensely, leading to a greater counter-pressing fraction, which, in turn, results in quicker regaining of possession, potentially increasing their possession share. The correlation coefficient is lower (0.36) for individual matches, suggesting greater complexity that warrants further investigation.
The author also mentions a particularly intriguing finding is Burnley’s high counter-pressing fraction. While most analysis on Burnley has focused on their defensive structure within their own box and its impact on defensive performance in relation to expected goals (xG), the figures demonstrate that Burnley employs a relatively aggressive counter-press, especially considering their possession share.
These insights shed light on the interplay between possession, counter-pressing, and team performance. The observed variations in counter-pressing fraction among teams highlight the tactical diversity and strategic choices made by managers. By examining these metrics, researchers and analysts can deepen their understanding of team dynamics, uncover nuanced tactical patterns, and evaluate the effectiveness of pressing strategies in different contexts.
Burnley’s Identity: Defensive Counter-Pressing
This section delves into Burnley’s counter-pressing strategy, revealing intriguing insights into their approach and its effectiveness. Despite being often associated with a defensive-minded style, Burnley demonstrates a proactive implementation of counter-pressing, aimed at preventing counter-attacks and impeding opponents’ attacking progress.
Examining the statistics, Burnley counter-presses an average of 18 possessions per game, a figure that surpasses the league average and is only marginally lower than Manchester City. However, their ability to regain possession within five seconds falls below expectations, occurring only 2.5 times per game, which is lower compared to other counter-pressing teams. Their counter-pressing regains-to-possessions ratio of 14% places them 17th in the league, indicating room for improvement.
In terms of limiting opponent shots, Burnley’s counter-pressing is ranked fourth least effective, with 13% of such possessions resulting in shots conceded, exceeding the league average of 10%. However, an advantage for Burnley is that these possessions align with the league average in terms of length and speed of attack, allowing the team to reorganize their defensive structure before conceding shots.
The prevailing discourse often highlights pressing as an attacking weapon, focusing on teams that rapidly regain possession to launch swift counter-attacks, exemplified by the likes of Liverpool and Tottenham Hotspur. Consequently, Burnley’s defensive-oriented counter-pressing approach, aimed at thwarting counter-attacks and impeding attacking progress, may not receive as much attention.
Burnley’s manager, Sean Dyche, has been associated with the tactical traditions of British managers, who are not typically associated with pressing tactics. However, Dyche’s admiration for Guardiola’s Barcelona and the implementation of pressing ideas at Burnley demonstrate his ability to combine counter-pressing and a low-block defensive structure with numbers behind the ball. This tactical approach draws parallels to the traits exhibited by Diego Simeone and Atlético Madrid, highlighting the astute nature of Burnley’s defensive strategy.
Conclusion
The presented analysis showcases the remarkable capabilities of StatsBomb’s new pressure event data in shedding light on crucial aspects of the modern game. This data enables a direct translation of tactical principles, providing a clear distinction between underlying processes and outcomes, marking a significant advancement in the field of analytics. Surprisingly, the analysis also reveals intriguing parallels between Pep Guardiola’s iconic Barcelona team and Sean Dyche’s Burnley, uncovering unexpected connections. This analysis serves as a mere glimpse into the possibilities offered by StatsBomb’s new data, with further exploration and insights anticipated to emerge in the coming months and beyond.
References
Morgan, W. (2018, May 21). How StatsBomb Data Helps Measure Counter-Pressing. https://statsbomb.com/articles/soccer/how-statsbomb-data-helps-measure-counter-pressing/


