The Art of the Pass: A Quantitative Model for Evaluating Football Pass Effectiveness
A data-driven model using tracking data to quantify football pass effectiveness, introducing novel measures that assess how well a pass disrupts the opposing defense, providing deeper insights.

Introduction
Nowadays football players are consistently monitored during training and matches by tracking technology. The surge in available data, reaching approximately 3.1 million data points per regular match, paves the way for extensive analysis in team sports performance. The use of data science methodologies, particularly machine learning, is identified as a promising avenue for leveraging this wealth of data for insights into team tactics, player evaluation, and training management.
Traditionally, the evaluation of tactical performance relied on notational data, encompassing standardized coded notes and outcome measures like frequencies and proportions of events during matches. However, this approach oversimplifies tactical performance, reducing it to a series of events rather than considering it as the management of space, time, and individual actions. Integrating tracking data with event data is seen as a more promising approach to gain deeper insights into tactical performance, especially concerning the influence of specific actions or tactics on spacing and timing of teammates and opponents.
Passes, a fundamental event in football, are a critical focus for tactical analysis. Passing parameters such as pass completion rate, number of passes, and pass direction are considered vital predictors of success and are instrumental in distinguishing different tactical styles and creating goal-scoring opportunities. Yet, existing approaches often fail to incorporate contextual variables and the interaction with opponents, providing a limited understanding of passing behavior.
The primary limitation in current passing evaluations is the narrow focus on goal-scoring probabilities, categorizing passes as “good” primarily if they lead to goal-scoring opportunities within a defined timeframe or increase the chance of a shot on goal. This approach predominantly recognizes forward passes as effective, overlooking the value of sideways or backward passes, which may disrupt the defensive organization and create opportunities indirectly. Hence, a new approach is proposed, focusing on spatiotemporal aggregates to evaluate successful passes based on tracking data.
The objective of this study is to introduce an innovative approach to assess successful passes by analyzing tracking data from competitive professional league football matches. The approach utilizes basic data science methods, evaluating successful passes by analyzing changes in the positioning of the defensive team and its subunits following a pass. The fundamental assumption is that teams need to create space and disrupt the defensive organization to generate scoring opportunities. This is supported by the notion that possessions are more likely to produce goal-scoring opportunities when performed against a disordered defense. Thus, passes resulting in increased movement within the defending team are deemed beneficial for the attacking team. The focus is on evaluating the process of the game rather than solely considering goal-related events. The subsequent sections delve into the spatiotemporal parameters underpinning the concept of defensive disruptiveness and discuss recent data science approaches in passing evaluation, emphasizing the unique perspective offered by defensive disruptiveness compared to existing measures.
Related Work
Spatiotemporal analysis of tactical behavior in football
In this section, the paper discusses the evolving landscape of spatiotemporal analysis in football, particularly focusing on tactical behavior. The primary use of tracking data has traditionally been for monitoring a player’s physiological and physical loading. However, recent times have witnessed a surge in the popularity of spatiotemporal tactical analysis among sports and computer scientists.
In the sports science domain, aggregate variables like team centroid, line centroid, stretch index, team surface area, and team spread have been developed to summarize raw tracking data and capture the complex spatiotemporal dynamics of football. These variables have been utilized to study game flow in various contexts, such as small-sided games, Champions League football, and Brazilian professional football games. By reducing the complexity of tracking data into consistent aggregates, these variables offer a comprehensive view of tactical behavior, enabling analysis based on complete match data rather than specific match events.
However, these spatiotemporal aggregates have primarily been applied in experimental settings like small-sided games, and a single spatial aggregate might not adequately represent the intricate dynamics of tactical performance in competitive 11 versus 11 matches. The section emphasizes the potential of combining techniques from data science and sports science to explore new avenues for studying tactical behavior in football. Data science methodologies provide advanced tools to study large quantities of tracking data, enabling the discovery of hidden coordination patterns, modeling of game situations, event classification, and prediction based on extensive data.
The intersection of data science and sports science has spurred interest in novel areas of research, particularly in studying passing, a critical aspect of football. Traditionally, passing studies relied on notational analysis, but the availability of comprehensive tracking data allows for more intricate designs, considering interactions between two teams. Incorporating tracking data has enriched the analysis of passing by modeling pass options, objectively quantifying pass effectiveness, and enhancing insights into passing performance. The integration of data science methods in this domain holds promise for deeper understanding and analysis of spatiotemporal aspects of football tactics.
Quantifying pass effectiveness
In the pursuit of quantifying pass effectiveness in football, several models have been developed, each offering unique approaches and considerations. Link et al. introduced a model focusing on the change in goal-scoring probability resulting from a pass, quantifying this as “dangerousity” based on field position, ball control, defensive pressure, and player density. The action value of a pass is defined as the change in dangerousity between the pass and the subsequent reception. However, this model heavily ties pass effectiveness to goal-scoring opportunities, potentially undervaluing passes aimed at creating space or relieving defensive pressure.
Power et al. proposed a similar approach, assessing pass effectiveness by quantifying the risk and reward associated with a pass. Pass risk considers the pass difficulty based on various factors, while pass reward measures the likelihood of a goal occurring within the next 10 seconds. However, this 10-second window may limit the model’s accuracy as events following the pass can influence the final outcome, making it challenging to attribute a shot on goal solely to a single pass.
Rein et al. sought to address the bias towards goal-scoring opportunities by using space control as a measure of pass effectiveness. They computed pass effectiveness based on the change in space control in the final third of the field and the number of outplayed defenders. While this model doesn’t directly link pass effectiveness to goal creation, it still tends to favor forward passes, potentially undervaluing sideways or backward passes.
In contrast, the pass classification model by Chawla et al. stands out as the only model capable of automatically assessing the effectiveness of all passes without linking them to goal scoring. Utilizing a machine learning classification algorithm and a comprehensive set of predictor variables, it replicates subjective pass ratings given by human observers. However, it doesn’t provide a continuous quantitative measure of pass effectiveness, making it less effective for objective rankings of passes or players.
Positioning of the work
The paper discusses various existing approaches to evaluate passes in football by integrating event and tracking data, emphasizing the potential of data science in understanding tactical performance. However, it points out limitations such as the strong association of pass effectiveness with creating goal-scoring opportunities, potentially leading to an overemphasis on forward passes and passes in the final third of the field. To address these limitations, the paper introduces a novel measure called defensive disruptiveness (D-Def) score. This score is designed to evaluate passes by measuring changes in defensive organization, utilizing a principle component analysis to merge spatiotemporal aggregates that describe a team’s organization and subunits. The D-Def score’s validity is demonstrated by its strong correlation with the overall movement of defending team players. The study aims to showcase the D-Def score’s ability to differentiate between passes and players. Additionally, it explores the predictive values of different passing parameters, such as passing velocity, length, and angle, on defensive disruptiveness, shedding light on which passes induce high defensive disruptiveness and whether the pass direction significantly influences the D-Def score. Overall, this work endeavors to establish the D-Def score as a valid measure for evaluating passing effectiveness while mitigating biases towards forward passes.
Preliminaries
Input data
In this section, the paper outlines the preliminaries, specifically focusing on the input data and the preprocessing steps employed for the model. The input data comprise tracking data of players and the ball, acquired using a semi-automatic optical tracking system called SportVU. The system captures X and Y coordinates of players and the ball at a frequency of 10 Hz. The pitch dimensions are standardized, with the X-axis spanning from 55 to -55 meters and the Y-axis from 35 to -35 meters. The data from each match undergoes preprocessing using ImoClient software, involving filtering with a weighted Gaussian algorithm (85% sensitivity) and automated detection of ball possessions and events based on tracking data. The preprocessed data, including tracking and ball event data, are imported into Python for further analysis, visualization, and statistical processing using various libraries such as NumPy, Pandas, SciPy, Scikit-learn, StatsModels, Matplotlib, and Seaborn. Tables 1 and 2 illustrate the structure of the preprocessed data frames for tracking and ball event data, respectively. This foundational information sets the stage for the subsequent analyses and modeling detailed in the paper.


Experimental data
In this section, the paper defines the experimental data collection process. The researchers gathered tracking and pass data from 18 competitive professional football matches. These matches involved one team playing against 13 different opponents during the 2017–2018 Dutch premier league (Eredivisie) season. The dataset comprised a total of 16,943 passes, out of which 10,481 were successfully received by a teammate, resulting in an average pass completion rate of 61.8%. To prepare the data for the model, specific criteria were applied to select relevant passes for analysis. Time-windows of the game without missing or erroneous data were preselected, and completed passes with a passing length greater than 2 and less than 90 meters, and a passing velocity less than 40 m/s were chosen. These criteria were chosen to filter out erroneous or unintentional data, ensuring the accuracy and relevance of the dataset. A total of 6,460 passes met these criteria and were used for subsequent analysis and modeling. This information provides a crucial foundation for understanding the dataset and the subsequent analyses conducted in the study.
Pass parameters
In this segment of the research, the focus is on pass parameters in football analysis. The authors describe the methodology for determining pass characteristics. The ball event data’s coordinates are first transformed to positive coordinates, considering a standardized playing direction. The passing length (L) in meters is calculated using the distance between the passer and the receiver along the X-axis (Xpass) and Y-axis (Ypass). The passing angle (a) with respect to the Y-axis is determined using mathematical equations. Additionally, the passing velocity (Vpass) in meters per second is computed based on the time stamps of the pass and subsequent reception. Passes are further classified into backward, sideways, or forward based on passing angles, which are divided into 90 bins. The provided Figure 1 illustrates all the pass parameters, providing a clear representation of the methodology for analyzing passes in football.

Ethical considerations
In this segment, the paper underscores the ethical framework surrounding the data collection for the study. The researchers obtained data from professional football clubs, emphasizing that this data was initially gathered by the clubs for performance analysis and not specifically for experimental purposes related to this study. The subjects of the study are professional players who have consented to their clubs collecting, sharing, and storing their data. To uphold privacy standards, all personal data were anonymized before any analysis was conducted. The study received approval from the participating clubs, who granted written informed consent for the utilization of their data. The study adhered to the ethical principles delineated in the Declaration of Helsinki, ensuring the ethical integrity and propriety of the research process and data usage.
A Model of Defensive Disruptiveness
Defensive movement
The research paper introduces a model focusing on defensive disruptiveness in football. The authors detail the construction of two key measures related to defensive movement. The first measure, termed I-Mov (total individual movement), quantifies the collective movement of defensive players on the field. The second measure, D-Def (disruption of defensive organization), is designed to assess how passing influences defensive arrangements, aiming to disrupt their structure and consequently create space for offensive maneuvers. The distinction between movement and disruption is highlighted, emphasizing that movement alone might not guarantee effective space creation, necessitating a comprehensive analysis considering both aspects. The overarching goal is to grasp how passing affects defensive strategies and how this, in turn, influences the available space for offensive play.
Individual movement
This section focuses on detailing the construction of a metric to measure individual movement in football. The measure integrates two primary components: absolute displacement in the longitudinal (X-axis) and lateral (Y-axis) directions. The authors describe the calculation process, starting with the computation of the sum of absolute displacement in the X and Y positions for all defending players within a specified time window extending from the moment the pass was initiated (t0) to 3 seconds later (t0 + 3). The resulting sums are concatenated to formulate a comprehensive metric termed I-Mov, representing the collective movement of defending players during this crucial 3-second interval. The rationale behind choosing a 3-second window is discussed, considering its relevance in capturing the impact of a pass in a football match while avoiding encompassing subsequent passes that might influence the analysis.
Disruption of the defense
The authors elaborate on the methods used to objectively quantify the disruption of the defensive organization in football. The authors introduce several metrics to gauge defensive movement and organization. Initially, they describe the calculation of the displacement of average X and Y positions (centroids) for different segments of the team: the full team, defensive line, midfield, and attacking line. This displacement is assessed between the moment a pass is initiated (t0) and 3 seconds later (t0 + 3), considering the team’s initial formations and accounting for substitutions. The change in surface area and spread of the team during this time period is also computed. Surface area is determined as the smallest convex hull area containing player positions, while spread is quantified using the Frobenius norm of player positions. To create a comprehensive measure for the disruptiveness of defensive organization, a principal component analysis is conducted based on the displacement measures of all passes in the dataset. This approach aims to provide a holistic understanding of the defensive organization’s impact and how it changes in response to passes during a football match.
Principal component analysis
Here the researchers discuss the application of Principal Component Analysis (PCA) to quantify the disruption of defensive organization in football. Prior to PCA, they standardized all variables. The correlation matrix indicated significant correlations, meeting factorability requirements. The first three factors obtained from PCA, with eigenvalues greater than 1, collectively explained 83.3% of the variance. Composite scores for each factor were computed using factor loadings.
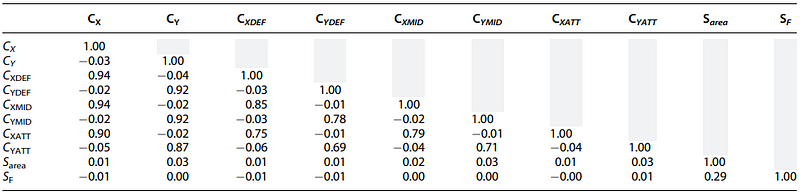
The disruption of the defensive organization was measured by the cumulative sum of the three absolute factor scores. To make this score unitless and account for directional differences, absolute scores were utilized. The resulting D-Def score ranges from 0 to 20, representing the extent of disruption to the defensive structure, with 0 indicating no disruption and 20 representing maximal disruption across all components simultaneously. The use of PCA here aids in consolidating various defensive movement metrics into a comprehensible, holistic measure.

Relation between individual movement and defensive disruption
In this portion of the paper, the authors explore the relationship between individual movement (I-Mov) and defensive disruption (D-Def) in football. They had previously postulated that higher individual movement could lead to a disruption in collective defensive organization. To validate this hypothesis, they analyzed the correlation between total individual movement (I-Mov) and defensive disruption (D-Def) using Pearson correlation coefficient, resulting in an R-squared value of 0.74. This robust correlation between individual movement and defensive disruption substantiates their initial hypothesis, affirming that increased individual movement is indeed associated with a disturbance in the defensive structure.

Experimental Results
Ranking passes and players
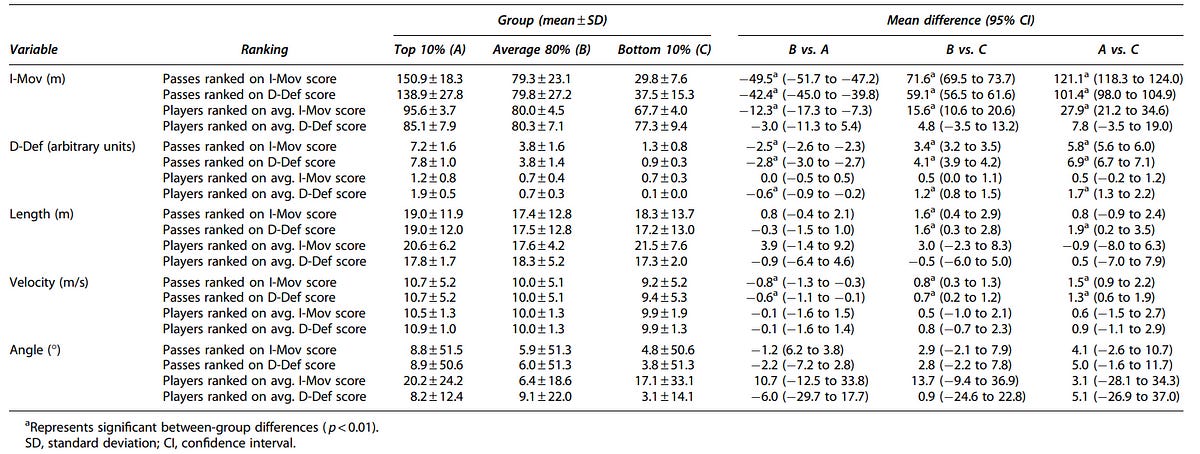
In this section, the authors present the results of their experimental analysis, focusing on ranking passes and players based on the I-Mov and D-Def measures. They aimed to demonstrate the sensitivity of these measures in assessing pass and player effectiveness. The analysis involved ranking all 6460 passes in the dataset using both I-Mov and D-Def measures, enabling a comparison of the 10% most effective, 80% average effective, and 10% least effective passes. Similarly, players were ranked based on their average I-Mov and D-Def scores, considering only players with over 25 passes to ensure representativeness.

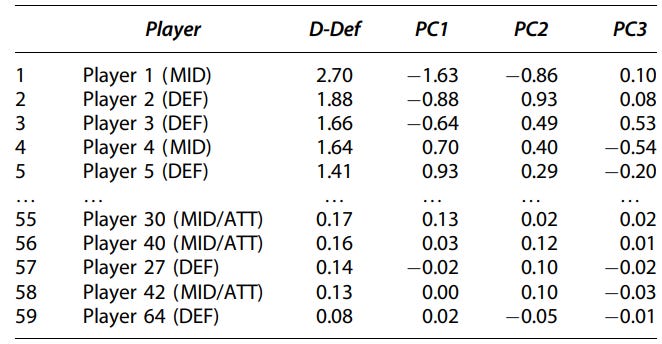
The results were used to compare pass effectiveness and characteristics among different groups of players and passes. The average scores for I-Mov and D-Def across these groups were visualized, and comprehensive data on pass characteristics and differences between groups were presented in tables. This empirical analysis illustrated the discriminatory power of I-Mov and D-Def measures in evaluating both passes and players in football, providing valuable insights into their effectiveness.


Passes ranked on I-Mov
Next, the authors describe an analytical approach where passes are ranked based on the I-Mov measure. A one-way ANOVA (Analysis of Variance) was employed to compare several pass-related metrics, including I-Mov, D-Def score, pass length, pass angle, and pass velocity, among the top 10%, average 80%, and bottom 10% of passes ranked according to I-Mov. The ANOVA results revealed significant differences among these pass groups for I-Mov, D-Def score, pass length, and pass velocity, but no significant differences were found for pass angle. Tukey’s post hoc tests were utilized for further analysis of the between-group differences.
This analysis aimed to provide insights into how different pass rankings based on I-Mov correlate with various pass characteristics and defensive disruption scores. The statistically significant differences shed light on the relationships between movement measures, pass attributes, and defensive disruption.
Passes ranked on D-Def
The authors also present the same analytical approach as before, but in this case passes are ranked based on the D-Def (Defensive Disruptiveness) score. The ANOVA results demonstrated significant differences among these pass groups for I-Mov, D-Def score, pass length, and pass velocity, with no significant differences observed for pass angle. Subsequent Tukey’s post hoc tests, considering Bonferroni correction, were employed to analyze the specific differences between these groups.
This analysis aims to offer insights into the relationship between defensive disruptiveness, pass attributes, movement measures, and how they influence pass rankings based on D-Def score.
Players ranked on average I-Mov
In continuation, the authors present a similar statistical analysis based on a one-way ANOVA to compare various metrics across the different groups of players ranked by their average I-Mov scores. The analysis divides the players as before into the top 10%, average 80%, and bottom 10% based on their I-Mov rankings. Subsequently, Tukey’s post hoc tests, considering Bonferroni correction, are employed to evaluate specific differences among these player groups.
The results indicate a significant effect of the ranking group on the average I-Mov, implying that player movement varies significantly across these groups. However, there are no significant effects observed for average D-Def score, average pass length, average pass velocity, or average pass angle, suggesting that these parameters may not be notably influenced by player movement as quantified by I-Mov scores.
Players ranked on average D-Def score
Finally, the researchers conduct the last one-way ANOVA comparison of different groups of players ranked by their average D-Def scores. The player groups are again divided based on their D-Def rankings and utilizing Tukey’s post hoc tests with a Bonferroni correction, the study then analyzes specific differences among these player groups.
The results demonstrate a significant effect of the ranking group on the average D-Def score, indicating notable variations in defensive disruptiveness across these groups. However, there are no significant effects observed for average I-Mov, average pass length, average pass velocity, or average pass angle, suggesting that these parameters may not be significantly influenced by defensive disruptiveness as quantified by D-Def scores.
Predicting the effectiveness of a pass based on pass characteristics
The study delves into predicting pass effectiveness using multiple linear regression models based on various pass characteristics. They observe notable distinctions in pass characteristics between the most and least effective passes. The researchers employ parameters such as pass length, velocity, angle, and X and Y pass locations to predict both total individual movement (I-Mov) and disruption of the defensive organization (D-Def).
The multiple linear regression model for I-Mov yielded a significant regression equation, indicating that pass characteristics significantly influence I-Mov. The predictors for I-Mov included X and Y pass locations, passing length, passing angle, and passing velocity, each with respective coefficients denoting their impact on I-Mov.
Similarly, the model for D-Def presented a significant regression equation, showcasing the substantial effect of pass characteristics on defensive disruptiveness. The predictors for D-Def encompassed X and Y pass locations, passing length, passing angle, and passing velocity, each with specific coefficients illustrating their influence on D-Def.
The coefficients related to passing velocity and length were particularly prominent in both regression equations. For instance, a 1 m/s increase in passing velocity corresponded to a 2.2 m increase in total individual movement and a 0.11-point increase in D-Def score. Additionally, a 10 m increase in pass length led to a 6.5 m rise in total individual movement and a 0.3-point augmentation in D-Def score. These insights underscore the significance of velocity and length in determining pass effectiveness.
Discussion
The discussion revolves around evaluating tactical performance in football, particularly focusing on passing, a fundamental aspect of the game. Traditional performance evaluation in football faces challenges due to the scarcity of valid outcomes like goals compared to the plethora of actions during a match. The introduced model, termed “passing disruptiveness,” aims to assess passing effectiveness based on the idea that a good pass leads to increased movement and disruption in the opponent’s defensive structure. The model considers spatial and temporal representations, such as team centroid, spread, surface, and subunit centroids (attacking, midfield, defending lines) to calculate a D-Def score, representing the change in defensive organization due to a pass.
The study employs a three-step validation approach, demonstrating a high correlation between overall individual movement (I-Mov) and defensive disruptiveness (D-Def), validating the D-Def score’s ability to distinguish between different passes, and showcasing its effectiveness in distinguishing between good and bad passers. The D-Def score is introduced to overcome limitations in previous models that evaluate passing behavior, particularly not overvaluing forward passes and considering the importance of sideways or backward passes in creating space and unbalancing the defense.
Passing angle was found to be a weak determinant of pass evaluation in this model, emphasizing that the D-Def score does not overemphasize forward passes. Passing length and velocity emerged as crucial factors in decreasing defensive organization. Long passes (19–30 m) at a velocity of at least 10.7 m/s significantly disrupted the defense. Additionally, on an individual level, good passers induced more longitudinal movement, creating space for forward passes. On a team level, the D-Def score is proposed as a tool to validate and optimize team tactics, potentially fatiguing the opponent with disruptive passes.
While the model presents promising results, certain challenges need addressing, such as incorporating pass completion rate, number of passes, and assessing the model’s relationship with scoring goals. Future work aims to include more games per player, diverse teams to prevent bias, and potential improvements like incorporating dynamic pitch values to enhance space creation assessment.
Conclusion
In conclusion, this study aimed to introduce a novel approach for evaluating passing in football, addressing the issue of overvaluing forward passes. The approach is centered on “defensive disruptiveness,” a continuous performance measure that is not reliant on infrequent events like goals or goal-scoring opportunities. It offers a robust proof of concept, demonstrating the validity of the D-Def score and its effectiveness in assessing individual plays, describing efficiency, and enabling comparisons among players and teams.
The D-Def score proves to be a valuable tool for researchers and practitioners, offering insights into playing systems and tactical group concepts. Moreover, it can be implemented in real-time during a match using tracking data, distinguishing it from approaches relying on notation data, which necessitate post-processing and are not applicable in real-time. This real-time applicability enhances its utility for both analysis and immediate decision-making during a match.
Additionally, the approach can shed light on players who significantly contribute to the game beyond goal scoring or assisting, highlighting their role in creating beneficial game situations. This innovative methodology has the potential for adaptation in other team sports sharing a similar structural framework, such as basketball, handball, or hockey, extending its applicability and impact beyond football.
References
Goes, F. R., Kempe, M., Meerhoff, L. A., & Lemmink, K. A. (2019). Not every pass can be an assist: a data-driven model to measure pass effectiveness in professional soccer matches. Big data, 7(1), 57–70. https://pure.rug.nl/ws/portalfiles/portal/66806513/big.2018.0067.pdf