


The Perfect Pass Formula: Can Physics Predict Success?
Using Physics to Quantify and Predict Pass Success in Professional Football

The following summary critically reviews the research paper titled "Physics-Based Modeling of Pass Probabilities in Soccer" by William Spearman, Austin Basye, Greg Dick, Ryan Hotovy and Paul Pop. All data, figures, and analysis presented here are drawn from their original work; I do not claim any authorship or ownership of the content. This summary has been written to provide a concise and technically informed synthesis of the paper’s findings, methodologies, and implications, while maintaining fidelity to the authors’ intellectual contributions.
1. Introduction
The modeling of pass probabilities in football has traditionally followed two principal paths: time-to-intercept models and machine learning approaches. Time-to-intercept frameworks calculate the duration a player needs to reach a ball, thereby evaluating potential receivers. Machine learning methods, while more flexible and data-driven, often yield models that are "difficult to conceptualize" [1, 2].
This paper introduces a hybrid method: a physics-based time-to-intercept computation embedded within a statistical model. The authors outline four key desiderata for this model: (1) it must yield interpretable probabilities; (2) it must be empirically grounded in real match data; (3) it must operate predictively using only data available at the moment of the pass; and (4) it must vary smoothly with respect to small differences in intercept times, ensuring continuity in the output.
By establishing such a model, the paper sets the foundation for four analytical tools: “receiving and interception efficiency, pass value, spatial pitch control, and hypothetical passing”.
2. Approach
Each pass is modeled as a Bernoulli trial, with success defined as a teammate executing a controlled touch after intercepting the ball. This formulation allows for inherent uncertainty, acknowledging that repeated attempts under identical conditions may yield different outcomes.
2.1. Ball Trajectory
To enable prediction at the time of the pass, the actual ball trajectory is replaced with a simulated one. The ball's initial velocity is approximated by averaging its movement over 0.4 seconds. While aerodynamic effects like drag are included, the Magnus force and rolling friction are excluded due to lack of spin data and context-specific friction variables.
2.2. Time to Intercept
Players’ interception times are computed by solving their motion equations under velocity and acceleration constraints.
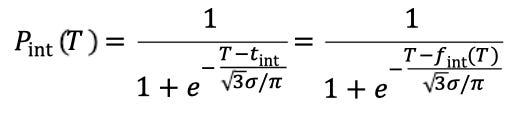
The intercept time t_int is compared with the ball’s flight time T, and their difference Δt=T−t_int determines feasibility.
Due to factors like reaction time, the model incorporates temporal uncertainty via a logistic distribution
2.3. Time to Control
The likelihood of gaining control after interception is modeled using an exponential distribution. The probability of controlling the ball within time t is:
where λ is the control rate parameter, representing proximity-based control likelihood.
2.4. Model
The final model combines the cumulative distributions of interception and control. For a player j, the probability of receiving the ball by time t is given by:
Summing Pj(t) over all potential teammates (excluding the passer) yields the total pass success probability.
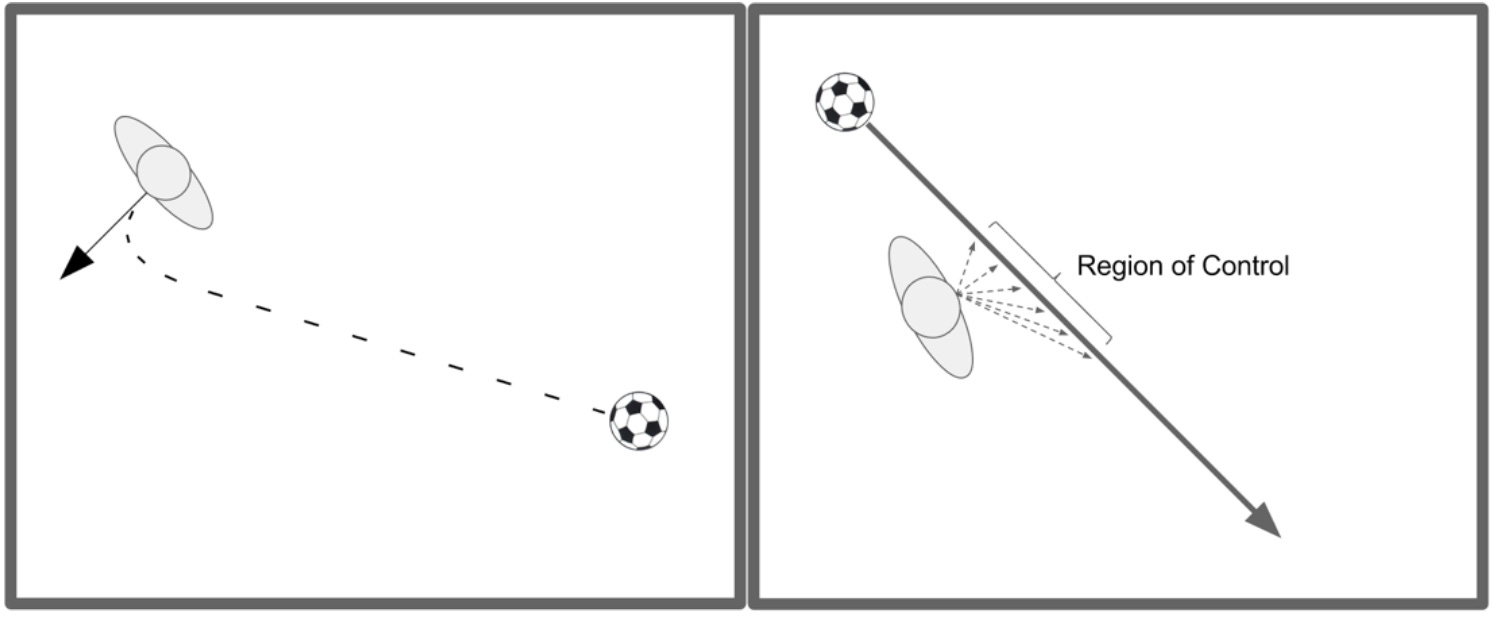
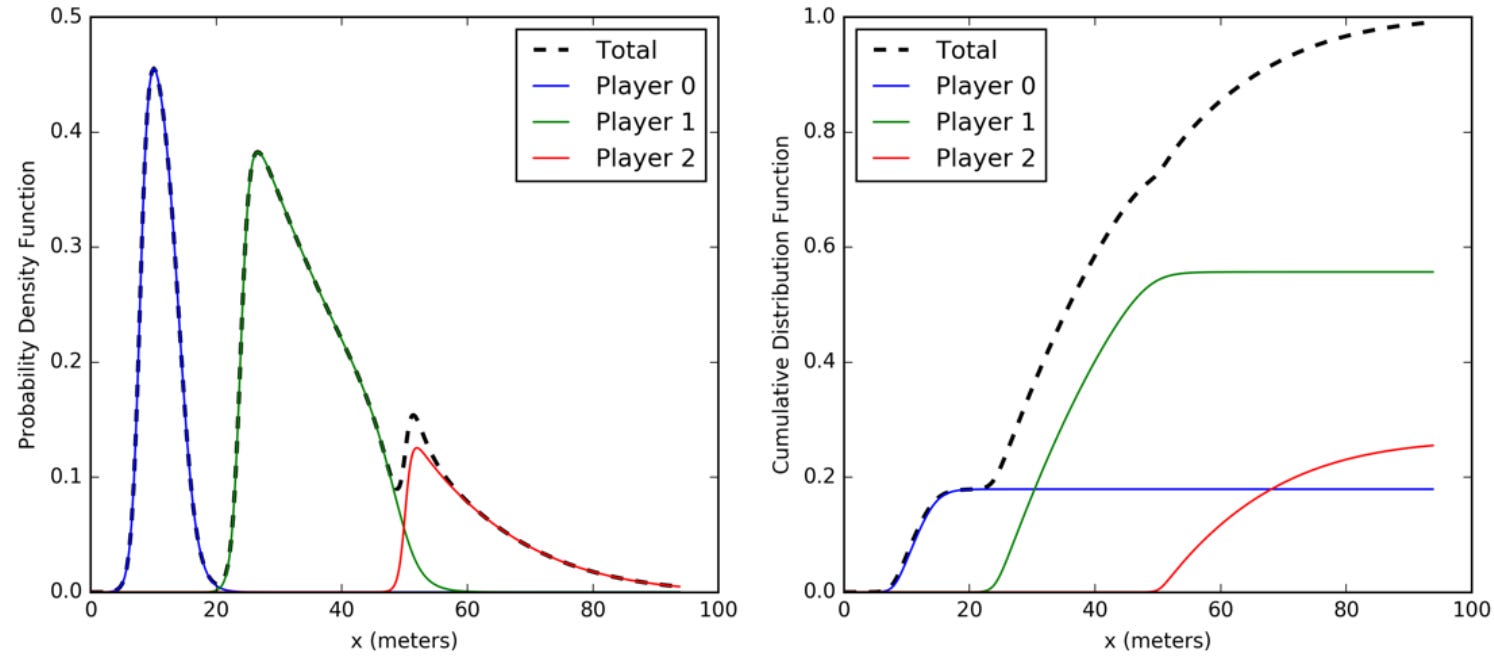
2.4.1. Understanding the Model
An illustrative example highlights how different player trajectories produce varied receiving probabilities depending on position, timing, and ball speed.
A fast-moving ball favours players in optimal positions, while control regions and interception times evolve dynamically over the ball’s trajectory.
3. Data
The dataset comprises tracking and event data from 38 Crystal Palace matches in the 2015–2016 Premier League season. Player and ball positions were captured at 25 Hz, and events such as passes, fouls, and goals were logged, though without specifying the intended recipient.
3.1. Processing and Selection
The actual recipient of each pass was identified by locating the next “controlled touch” event in the event data, using only reliable indicators (e.g., pass, tackle, ball recovery, goalkeeper pick-up). Synchronizing event and tracking data allowed precise localization of pass start frames, yielding initial conditions for the ball and all players.
Only passes lasting between 0.5 and 10 seconds and with curvature under 5% were retained. Passes going out of bounds were excluded. This filtering left 10,875 passes—5,404 for training and 5,471 for testing.
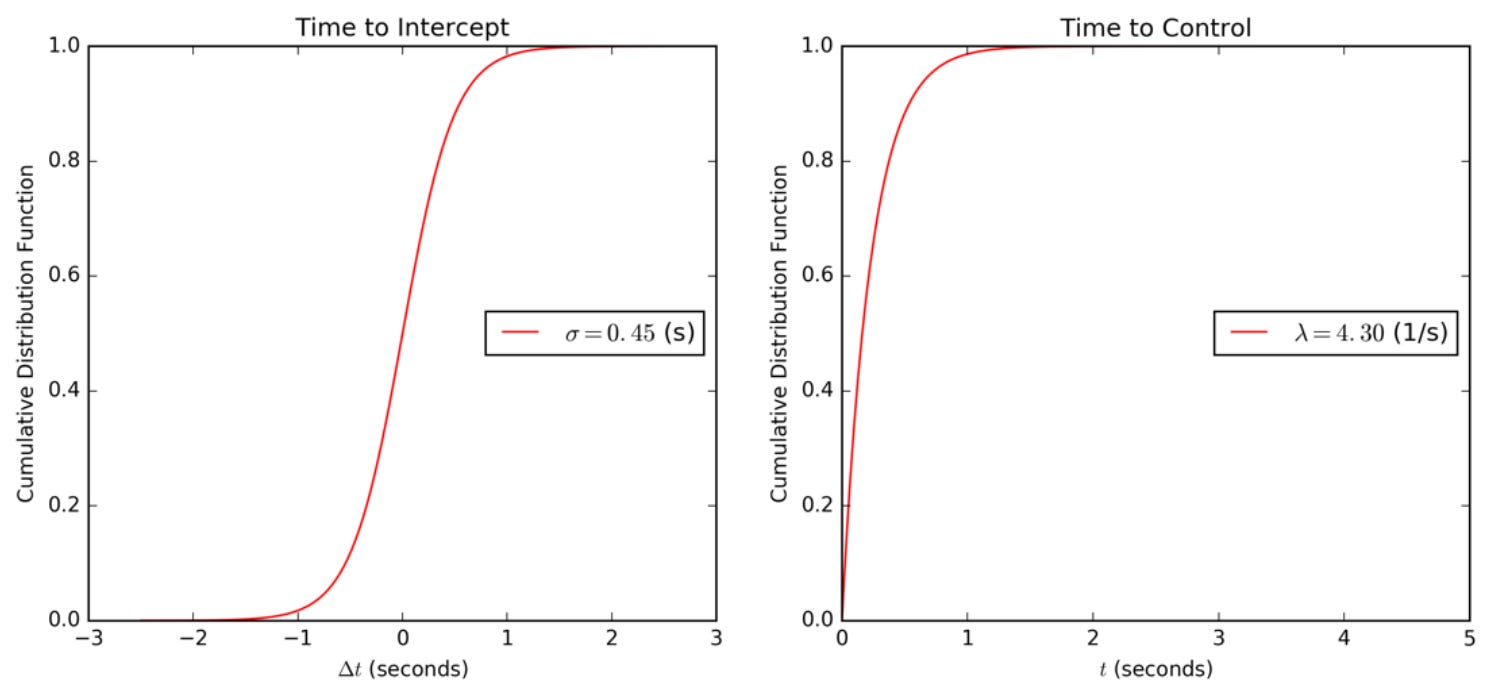
4. Fitting
Each pass is modeled as a Bernoulli trial, with success probability p dependent on parameters σ (temporal uncertainty) and λ (control rate). The model maximizes the likelihood across all training passes by minimizing the sum of negative log-likelihoods:
A grid search across parameter space yields stable fits with best estimates:
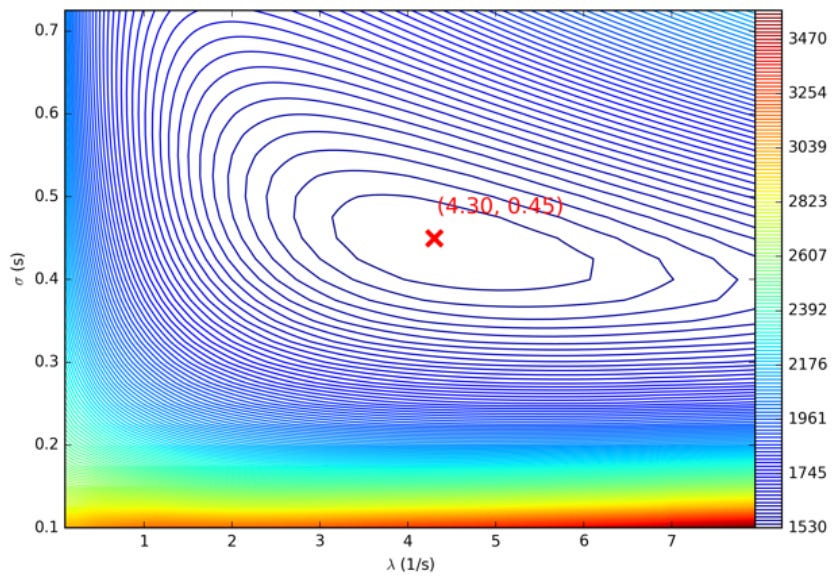
These values reflect realistic temporal uncertainty in player response and ball control likelihood, with most players achieving control within one second and interception times typically varying by ±1s.
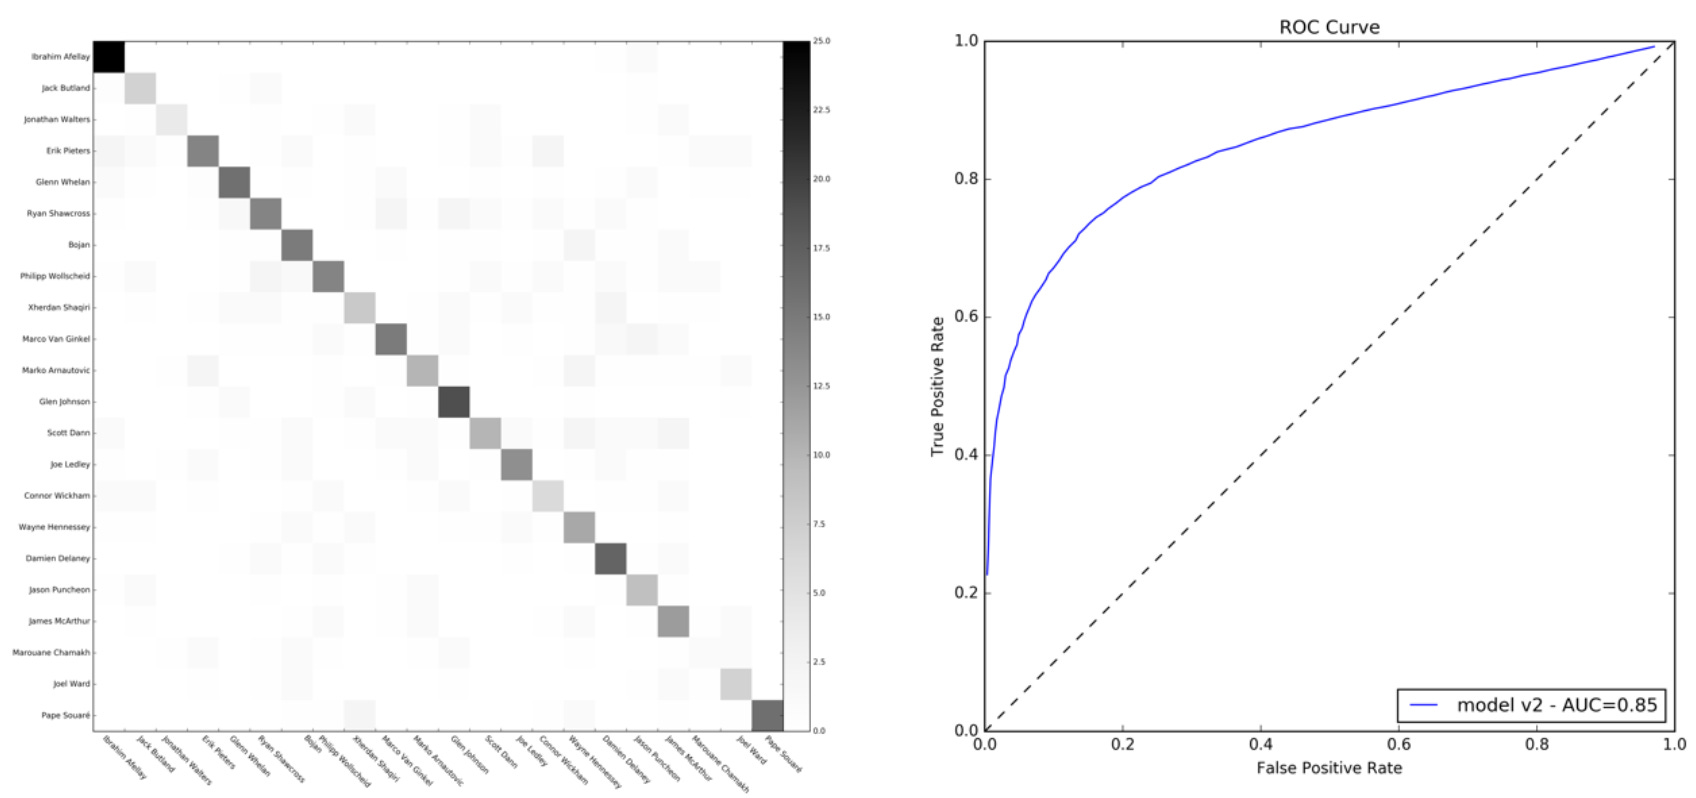
4.1. Fit Results
The model achieves 80.5% accuracy in predicting pass success and 67.9% in identifying the correct receiver on a 12-game test set. Receiver prediction is limited by tactical constraints—players may not always attempt to receive passes even when favored by the model. Adjusting the classification threshold from 0.5 to 0.27 raises accuracy to 81.9%, reflecting the skew toward successful passes (78.9% observed vs. 67.9% expected). Remaining discrepancies likely arise from unmodeled factors like spin (Magnus effect), player behavior, or data imperfections.
5. Applications
The model's probabilistic outputs support advanced performance metrics. Two such derived metrics are Receiving/Interception Efficiency and Pass Value, both of which show correlation with successful team performance indicators.
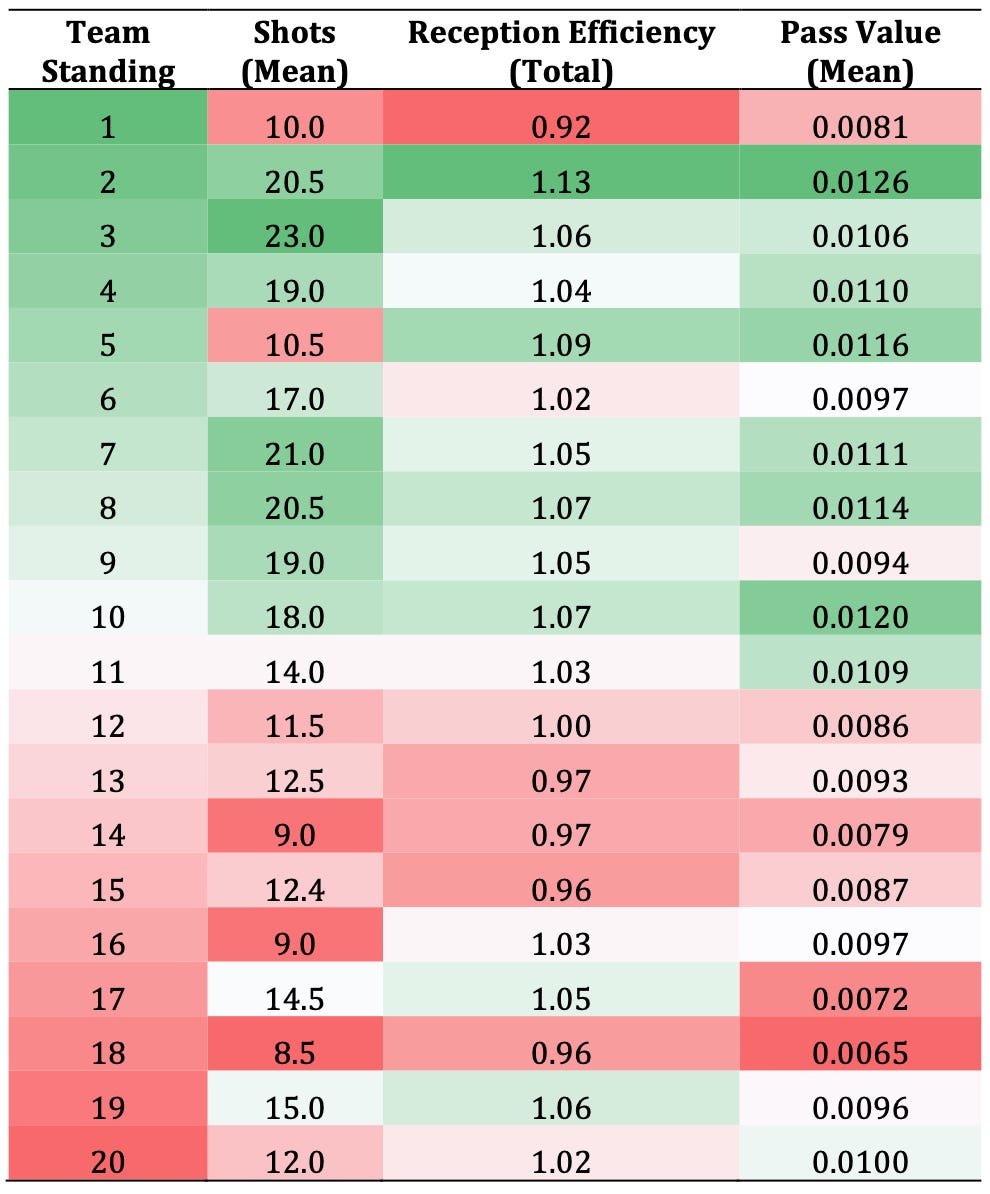
5.1. Receiving/Interception Efficiency
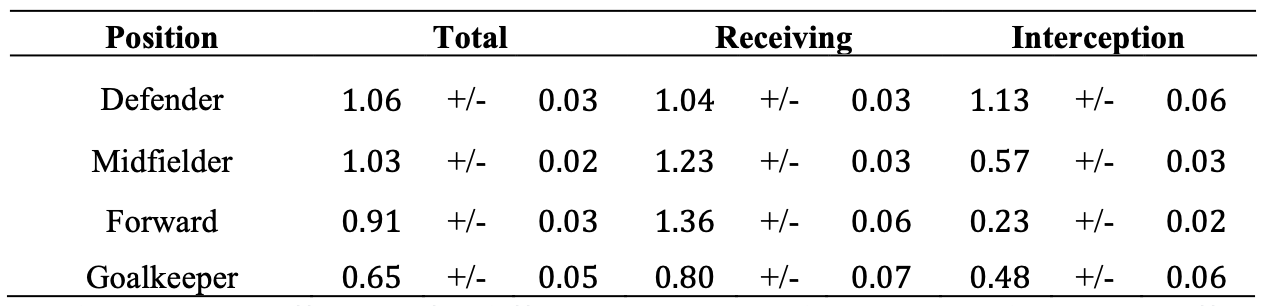
By aggregating pass probabilities per player using the Poisson binomial distribution, one can quantify how often a player receives or intercepts passes relative to expectation. For instance, "defenders and midfielders have the highest total receiving efficiencies," while forwards exceed expectations primarily on teammate passes (1.36) but not on interceptions (0.23), as shown in Table 1. These differences often reflect tactical roles rather than individual skill.
5.2. Passing Value
To evaluate pass quality, the model estimates the expected benefit of a pass using:
Here, f(x) quantifies field position value as a negative exponential of distance to goal. A higher Vj indicates greater strategic benefit. Despite its simplicity, this formulation captures tactical risk/reward tradeoffs.
5.3. Correlations
Both metrics correlate with performance. Total reception efficiency and mean pass value correlate strongly with shots (0.64 and 0.63) and attacking third passes (0.70 and 0.83), respectively, suggesting tactical and predictive validity. Table 2 supports these trends, aligning team success with higher efficiency and pass value metrics.
6. Extensions
This section introduces two model applications: Pitch Control and Hypothetical Passing, both leveraging the pass probability framework to generate new tactical insights.
6.1. Pitch Control
The Pitch Control Function (PCF) computes the probability that a player or team would control the ball at each location on the field, assuming the ball were placed there statically. This scalar field aggregates individual control probabilities derived from interception and control times. As with previous spatial models (e.g., Voronoi diagrams), the PCF incorporates dynamics such as player velocity and effort.
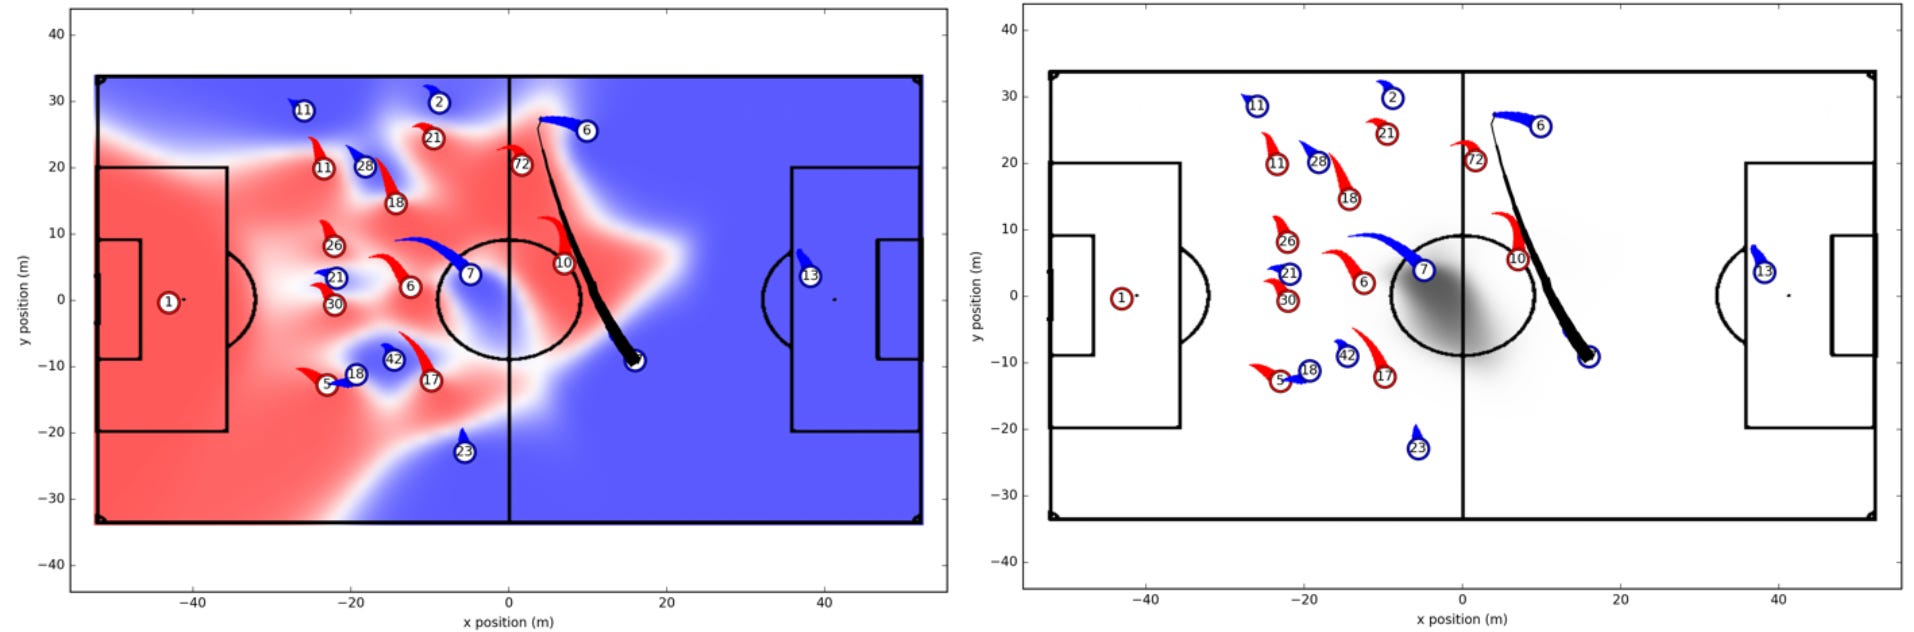
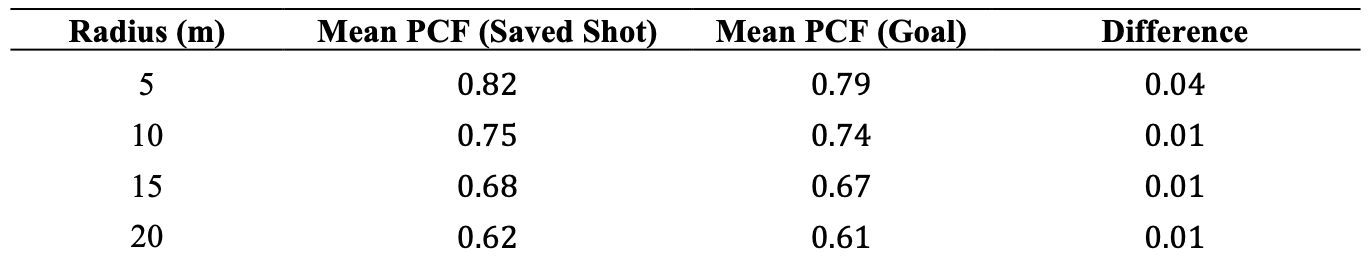
In tactical scenarios like corner kicks, the PCF quantifies defensive control. For example, "the defending team exerts, on average, 4% less control in the <5 m region" during corners that lead to goals compared to those resulting in saves (Table 3).

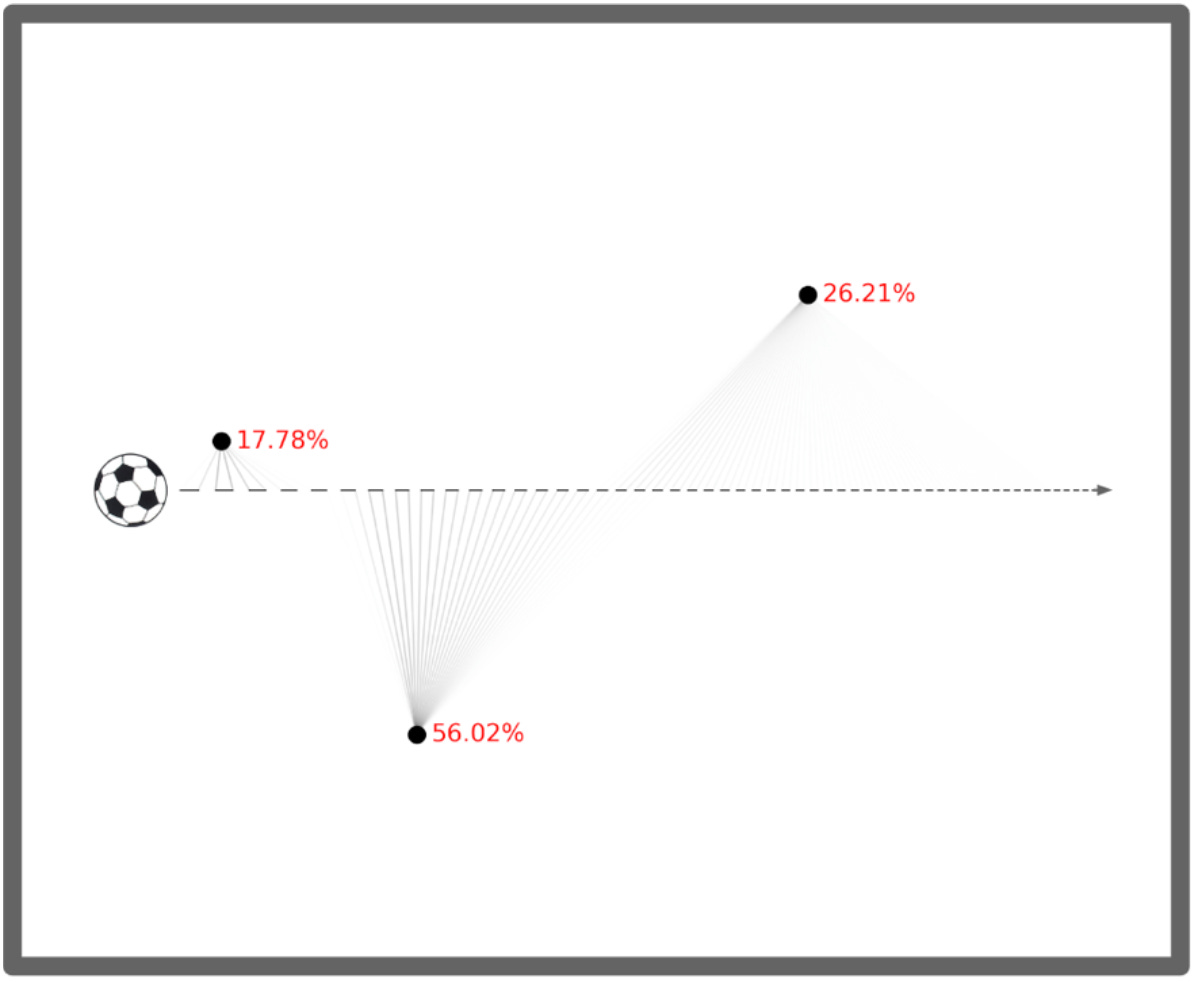
6.2. Hypothetical Passing
The model also evaluates hypothetical passes by simulating variations in pass velocity and direction. Optimal passes are identified by maximizing to-player probability using simulated annealing. Stability is assessed by perturbing the ideal velocity vector v⃗_ideal and analyzing the resulting range of probabilities P. High mean and low variance in P indicate easy passes; large variance suggests risky but potentially rewarding attempts.
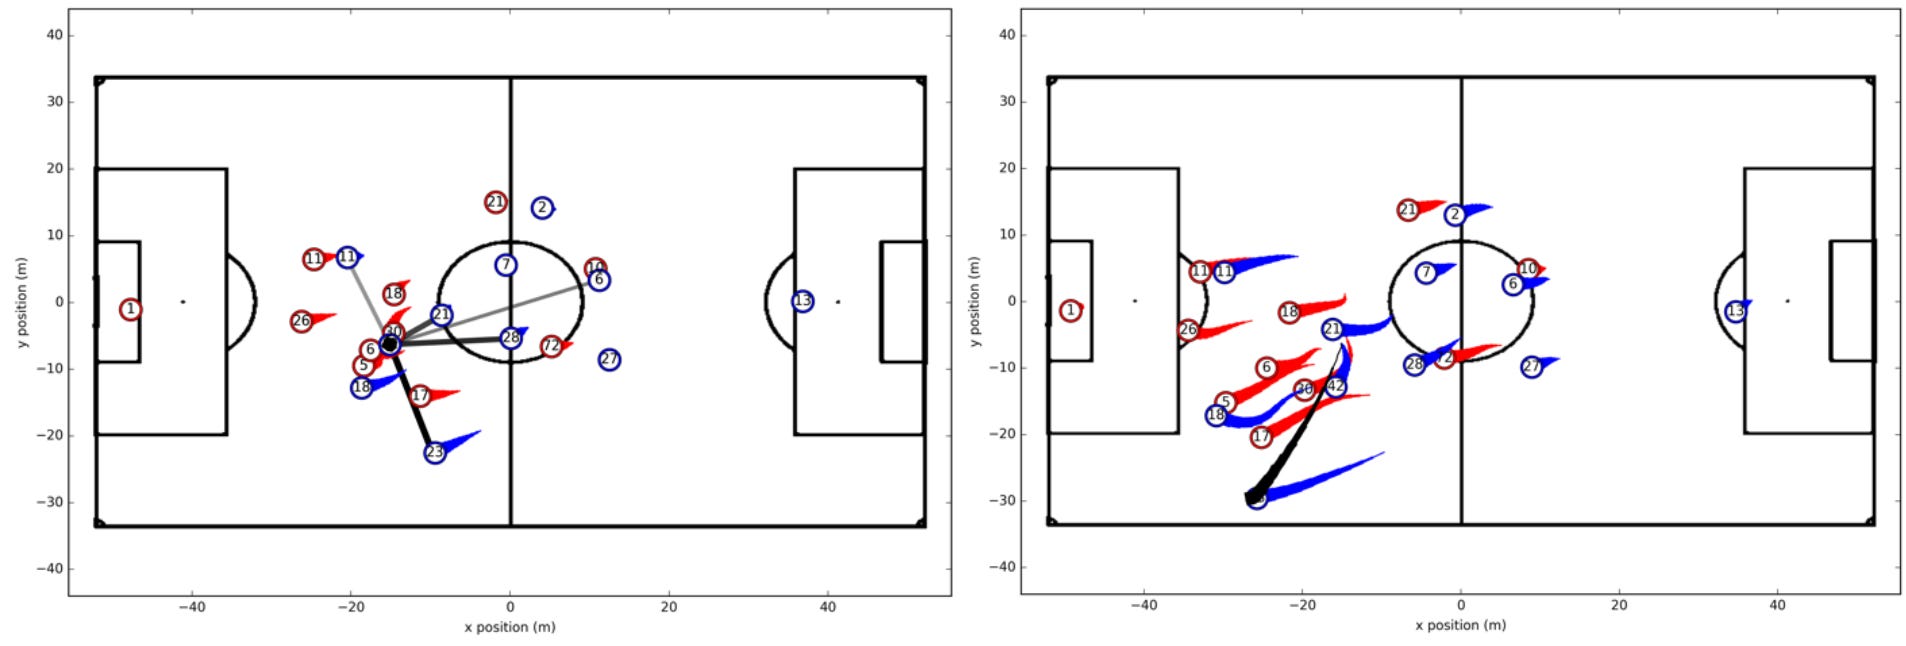
As illustrated in Figure 8, visual encodings of pass difficulty (line width for lower bound, opacity for upper bound) can represent decision quality. Although computational constraints currently limit large-scale analysis, this framework lays the groundwork for evaluating passing decisions with physical realism.
7. Conclusions
This study introduces a physics-based, data-driven model for predicting pass outcomes in football, grounded in time-to-intercept and control dynamics. By incorporating temporal uncertainty and control duration through logistic and exponential distributions respectively, the model yields probabilistic outputs that are smooth, interpretable, and predictive.
The model achieves high accuracy in identifying both the success of passes and the receiving player, enabling the construction of meaningful metrics such as receiving/interception efficiency and pass value. These metrics correlate well with key performance indicators like shots and final league standings.
Extensions like pitch control and hypothetical passing expand the model’s utility, offering novel tools for analyzing spatial dominance and decision quality. Overall, the model provides a robust foundation for tactical evaluation and player performance analysis using tracking data.
Learn More
My Recommended Books

References
Spearman, W., Basye, A., Dick, G., Hotovy, R., & Pop, P. (2017, March). Physics-based modeling of pass probabilities in soccer. In Proceeding of the 11th MIT Sloan Sports Analytics Conference (Vol. 1). https://www.researchgate.net/publication/315166647_Physics-Based_Modeling_of_Pass_Probabilities_in_Soccer
To keep this article concise, please refer to the original paper for the full list of references.