DAxT: A Deep Learning Approach to Valuing Defensive Actions in Football
A Novel Metric Inspired by the Original xT Model that Leverages Deep Learning for Better Valuation of Defensive Actions in Football

Introduction
The researchers introduce us to the problem of valuing actions in real-world domains and highlight the specific focus on valuing the actions of defenders in Football. The authors explain that while there has been significant progress in data science research and football analysis, valuing defensive actions remains a challenge due to the nature of these actions that often prevent events from occurring.
The paper emphasizes the importance of measuring player performance in team sports and discusses the unique challenges in football due to its low-scoring and dynamic nature. It mentions the widely used metric “Expected Goals (xG)” that quantifies the probability of a shot resulting in a goal, but notes the lack of similar metrics for defensive actions.
To address this gap, the authors propose a novel data-driven model called DAxT (Defensive Action Expected Threat) that focuses on valuing defensive and out-of-possession actions in football. Unlike traditional metrics that study actions leading to events, DAxT values defensive actions based on what they prevent from happening. The model combines research in football with deep learning techniques to accurately assess the impact of defensive actions.
The contributions of the paper are outlined as follows:
1. Introduction of the DAxT model for valuing defensive actions in football, utilizing deep learning techniques and real-world data from 760 games in the English Premier League.
2. Demonstration of the model’s accuracy in predicting the impact of future events, achieving a Mean Absolute Error (MAE) of 0.015.
3. Identification of top football defenders in the English Premier League using the DAxT model and validation against leading providers of football performance statistics.
Background
A background on related work in player performance metrics is proposed together with basic concepts in football, with a specific focus on the importance of defensive actions.
Related Work
The authors highlight the challenges in analyzing player performance in football due to its fast-paced and continuous nature, contrasting it with sports like baseball, which have discrete events for analysis.
The paper discusses the “Expected Goals (xG)” metric, which measures the quality of a shot based on factors such as shot location, defender proximity, speed of play, and game phase. Logistic regression is commonly used to model xG, as demonstrated in previous studies.

Another metric called “Expected Possession Value (EPV)” is introduced, which quantifies the expected outcome at each moment in a possession. EPV considers passing and turnover probabilities, action likelihood, and value expectations using logistic regression, convolutional neural networks, and deep neural networks.
The authors also present the “Valuing Actions by Estimating Probabilities (VAEP)” model, which evaluates the value of each action in a game by estimating the change in scoring and conceding probabilities. VAEP outperforms traditional player performance metrics and is effective in identifying talented players. Features such as action type, action location, time elapsed, and more are used to estimate the probabilities. The authors employ the CatBoost algorithm to train the binary classification models for offense and defense probabilities.
Additionally, the paper introduces the “Expected Threat (xT)” metric, which will be explored further in the article. xT directly relates to the model proposed in the paper, indicating its relevance and connection to existing player performance metrics.
If you want to learn about the xT and VAEP models you can visit my previous articles:


Overall, this section provides a comprehensive overview of existing player performance metrics in football and establishes the context for the proposed model by highlighting the importance of defensive actions in evaluating player performance.
Defending in Football
The focus is then placed on defending in football. The authors highlight that in football, teams switch between attacking and defending phases based on their possession of the ball. While scoring goals directly contributes to the scoreline, preventing goals from being conceded is equally crucial. Defensive strategies and styles of play vary among teams, with some opting for a deep defensive line and others employing a high-pressing approach to regain possession and launch counter-attacks.
The paper identifies two primary defensive actions in football: interceptions and tackles. An interception occurs when a defending player deliberately disrupts a pass by moving into the intended ball path. Anticipating the play, reading the game, and keeping the receiving player uncertain are key skills involved in successful interceptions. Additionally, retrieving the ball after an errant pass is also considered an interception.
Tackles, on the other hand, can be classified into two types. A blocking or standing tackle is executed when the defender remains on their feet and is typically employed when the ball-carrying player is approaching directly. The sliding tackle, on the contrary, involves the defender leaving their feet and sliding to make contact with the ball.
The authors point out that there is a limited amount of research focused on defensive actions like interceptions and tackles in football analysis. Most studies tend to emphasize attacking metrics that lead to direct contributions, neglecting the defensive aspects of the game. Consequently, the paper aims to address this gap by proposing the DAxT model, which quantifies different interceptions and tackles on the pitch. The specific details of how these actions are modeled are explained in the subsequent section.
Modelling Defensive Actions
In this section, the research paper focuses on modeling defensive actions in football and valuing their impact on the overall game. While it is relatively straightforward to assess the effect of attacking actions based on their outcomes, defensive actions pose a unique challenge as they typically prevent further actions from occurring. To address this, the paper proposes a logical approach to value defensive actions by evaluating what they have prevented and predicting the potential outcomes if those actions had not taken place.
The model presented in the paper aims to quantify the value of actions that prevent other actions from happening, and although the focus is on football, it can be applied in other domains where understanding the value of agents who prevent actions is important, such as security games and emergency response scenarios.
In football, events occur in a sequence or passage of play, denoted as S = {e1, e2, …, eN}, where S represents the sequence, e represents an event, and N is the number of events in the sequence. A sequence of events can end in various ways, such as the ball going out of play, a foul leading to a free kick, or a defensive action occurring to regain possession for the opposing team. The paper specifically focuses on two types of defensive actions: tackles and interceptions.
To value these defensive actions, the paper introduces the concept of “Expected Threat (xT)” from a previous study. xT assigns a value to each attacking event based on the probability of contributing to the attacking team’s likelihood of scoring a goal in that passage of play. The function 𝑓(𝑒) is defined to calculate xT for each event 𝑒 in a sequence 𝑆, which enables training a machine learning model to predict the xT value of an event that should have occurred after a given sequence 𝑆. This prediction is represented as 𝑓(𝑒𝑛) = Θ(𝑆𝑎), where 𝑓(𝑒𝑛) is the xT of the event 𝑒𝑛, Θ is the trained machine learning model, and 𝑆𝑎 is the passage of play composed of 𝑎 events before a defensive action 𝐷𝐴.
By predicting the “threat” of an event that did not occur, the model allows for valuing defensive actions by estimating the xT of the event that the defensive action prevented. The subsequent sections of the paper delve into the techniques and experiments conducted to develop and validate the described model.
The DAXT Model
The paper here introduces the DAXT (Defensive Actions xT) model, which is responsible for assigning values to defensive actions in football. The focus is on using deep learning techniques to predict the xT of an event that was prevented by a defensive action, allowing for the valuation of interceptions and tackles in games.
Expected Threat (xT)
As explained shortly before, the xT model aims to measure the threat level associated with any given game state during a football match. It achieves this by calculating the probability of a player with the ball shooting and scoring, as well as the probability of the player moving the ball to another location.
The xT value for a specific zone (x, y) is calculated using Equation 2. The left side of the equation represents the probability of shooting from that position (s𝑥,𝑦) multiplied by the probability of scoring (g𝑥,𝑦), which is typically represented by expected goals (xG). On the right side of the equation, the model considers the probability of the player moving the ball to other zones and the associated xT value of those movements. It should be noted that the probabilities of shooting and moving sum up to 100% since players can only choose between these two actions.

To calculate the xT value for a specific zone, the model requires prior knowledge of xT values for all other zones. To address this, the author suggests initializing all xT values to zero (𝑥𝑇𝑥,𝑦 = 0) for all zones and then iteratively evaluating Equation 2 until convergence. In each iteration, the xT value from the previous iteration is used. The model’s convergence is achieved when stable xT values are obtained. In the implementation, the paper reports running the xT model for 43 iterations until full convergence.
To illustrate the application of the xT model, the paper presents an example passage of play by Manchester United, where the xT values for each action are shown. The xT values reflect the impact of each action on the team’s threat level. For instance, passes and dribbles that move away from the goal have negative xT values, indicating a decrease in the probability of scoring. Conversely, a successful pass into the penalty box results in a large positive xT value, signifying an increased threat of scoring a goal.

In the next subsection, the paper delves into utilizing xT to train a predictive model capable of forecasting subsequent events after a sequence of actions.
Predicting What Was Stopped
Then, the paper focuses on predicting the future xT values of events using a neural network model. Specifically, a Multi-Layer Perceptron (MLP) model is constructed using the Keras library. The model takes a fixed number of actions (𝑆𝑎) in a passage of play as input (determined through experiments), and predicts the xT value of the action following this passage of play.
An example input instance 𝑆𝑎 is presented in Table 1, where each event 𝑒 in 𝑆𝑎 is represented by its xT value (𝑓 (𝑒)) and x, y coordinates. The output of the model is the xT value of the action after the passage of play, denoted as “xT4” in the given example.

To train the neural network model, a Mean Absolute Error (MAE) loss function is utilized due to the distribution of the target values, which is predominantly Laplacian with few outliers. The MAE loss function, as shown in Equation 3, compares the predicted xT value (𝑦ˆ𝑡) with the actual xT value (𝑦𝑡) for each instance.

Three main datasets are generated and employed for training and testing purposes. The first dataset consists of sequences 𝑆𝑎 of consecutive actions preceding successful events (𝑒 ≠ 𝐷𝐴). These sequences, illustrated in Table 1, serve as input for the neural network model, with the xT value of the subsequent event as the output. The training and testing of the model are performed using this dataset.
The other two datasets are created using valid passages of play 𝑆𝑎 that occurred before failed events interrupted by a defensive action (one dataset for interceptions and one for tackles). Once the model (Θ) is validated, these datasets are utilized as input to predict the xT value (𝑓 (𝑒𝑛)) of event 𝑒𝑛 that would have occurred without the defensive action. This xT output represents the valuation of each interception and tackle.
Assigning Value to Events
In this section, the paper focuses on assigning value to events using the DAxT model. The model is applied to two defensive action datasets to predict the xT value of the event that was interrupted by a defensive action (interception or tackle). Each interception and tackle is assigned its corresponding Interception value (𝐼𝑉) and Tackle value (𝑇𝑉). These defensive actions are then grouped according to the player who committed them. The total 𝐼𝑉 and 𝑇𝑉 values for each player are calculated by summing all the values together, and the average values per interception and tackle are also computed.
Furthermore, the metrics obtained from the DAxT model and two additional features, Clearance xT and Pass xT, are used to deduce an overall defender score. Clearance xT represents the expected threat of a clearance committed by a defender, while Pass xT considers the expected threat of each pass made by a defender. The inclusion of these features allows for the evaluation of defenders from both defensive and offensive perspectives in build-up play, which is increasingly important at the highest levels of the game.
The cumulative values of each feature for each player are utilized, and they are normalized to a score ranging from 0 to 100. Initially, when calculating the average score of the four features, the rankings favored defensive-minded players. To address this, weights are introduced to balance the impact of defensive values with offensive values in the equation for the final defender score. The weights are applied in a manner where the impact of defensive values is equal to the impact of offensive values. The equation for calculating the final defender score (𝑆𝑐) is presented, involving the Clearance xT (𝐶𝑥𝑇) and Pass xT (𝑃𝑥𝑇) values. The division by 3 is performed to obtain the mean of the defensive values, and the entire equation is divided by 4 to obtain the average of all values.

Empirical Evaluation
In this section, the paper presents the empirical evaluation of the models used in the study. The evaluation and optimization are conducted using a dataset collected from two seasons (2017/18 and 2018/19) of the English Premier League (EPL). The dataset provides a detailed breakdown of each game in the tournament, analyzing events such as passes, shots, tackles, and more. For each event, metrics including the event type, pitch coordinates, and outcome are recorded, making it a valuable real-world dataset for assessing the effectiveness of the models.
Experiment 1: Setting the Model Parameters
The goal is to determine the optimal number of previous actions (𝑎) to consider in the passage of play (𝑆𝑎) for training the model. The data is split into training and validation sets, with an 80–20 random split. The mean absolute error (MAE) is used as the evaluation metric.
The experiment investigates different values of 𝑎 and analyzes their impact on the model’s performance. Two arguments are considered: using 𝑎 = 1, which only includes the xT and location of the current event, and using a higher value of 𝑎 to incorporate more details about the passage of play. Table 2 presents the training and validation losses, the amount of training data, and the number of each defensive action (𝐷𝐴) for different values of 𝑎.

The results show that as 𝑎 increases, the number of available training data and defensive actions decreases. This is expected because finding consecutive successful and moving actions becomes more challenging as the passage of play lengthens. The table highlights that 𝑎 = 2 is selected as the optimal value. This choice strikes a balance between minimizing model loss and maximizing the number of defensive actions being evaluated.
By choosing 𝑎 = 2, the randomness of having only 𝑎 = 1 in 𝑆𝑎 is minimized, leading to better and more accurate sequences being considered. Although the number of defensive actions decreases, not valuing these actions is justified by the increase in accuracy. Moreover, selecting 𝑎 = 2 helps eliminate repeated actions that occur rapidly after one another, which may not reflect a defender’s true ability.
The findings from Experiment 1 provide valuable insights into determining the appropriate parameter setting for the model. By selecting 𝑎 = 2, the model can effectively capture the threat and value of defensive actions within the context of passages of play, enabling more accurate predictions and evaluations.
Experiment 2: Selecting the Features
In Experiment 2, the paper focuses on selecting the most effective features for the model. The goal is to explore different combinations of features beyond the conventional use of location and action type, as observed in existing football event data models. The additional features considered include body part, time of the game, and team ID, in addition to the already mentioned xT and location.
After conducting various tests with different feature combinations, the results reveal that xT and x,y coordinates are the most crucial features. Omitting either of these features, or both, leads to a significant increase in mean absolute error (MAE) by more than 0.002. On the other hand, incorporating additional variables along with xT and location only yields marginal differences of approximately 0.001 in the MAE.
The best-performing model, determined by the lowest MAE and a superior learning curve, is the one that exclusively utilizes xT and x,y coordinates as features. The inclusion of other variables either results in overfitting the model, especially in the case of team ID, which disrupts the initial tactical interpretation, or provides little discernible impact due to their general nature, such as body part (with the majority of actions being performed with the foot).
By focusing on the key features of xT and location, the model achieves better accuracy and avoids unnecessary complexity. This finding suggests that these features capture the essential information for analyzing and predicting football event data, while the inclusion of additional variables may not significantly enhance the model’s performance. Consequently, the selected feature set provides a more interpretable and effective representation of the underlying patterns and dynamics in the data.
Experiment 3: Model Prediction
In Experiment 3, the research paper focuses on evaluating the predictive performance of the model on unseen data. The model’s performance is assessed using the mean absolute error (MAE) metric, comparing the actual and predicted values on the test set. The obtained MAE loss of 0.016 is considered acceptable, given the training and validation loss functions discussed previously.
To further validate the model’s performance, statistical tests are conducted on the residuals, which are the differences between the actual and predicted values. The Levene test and Kolmogorov-Smirnov (KS) test are employed to compare the variances and probability distributions of the residuals from the training and testing datasets. The Levene test reveals a statistic value of 𝑣 = 1.209 and a p-value of 𝑝 = 0.272, indicating that the variances of both residuals are similar. Similarly, the KS test results in a statistic value of 𝑣 = 0.0174 and a p-value of 𝑝 = 0.8333 > 0.05, suggesting that the probability distributions of the two sets of residuals are the same.
Through the visualization of the fitted line on the probability plot (Q-Q plot), it is observed that the residual distribution exhibits a somewhat normal shape with long tails on both sides. The tails in the plot can be explained by the fact that the majority of data points (96.1%) fall within the range of 0.05 and -0.05. This observation is logical as actions with extremely high or low xT values are relatively rare compared to regular and less significant actions in football games.

Furthermore, a Pearson correlation test is conducted to assess the correlation between the model’s predictions and the actual values. The test yields an r-value of 𝑟 = 0.0985, indicating a positive but weak correlation, and a p-value less than 0.05, signifying statistical significance. These results demonstrate that, based on the available data, the trained model successfully predicts the xT of the next event in football games.
In summary, Experiment 3 confirms that the model performs well on unseen data, as indicated by the acceptable MAE loss. The statistical tests conducted on the residuals validate the model’s fit, demonstrating similar variances and probability distributions between the training and testing datasets. The visualization of the residual distribution and the Pearson correlation test further support the model’s predictive capability, highlighting its ability to forecast the xT values of future events in football matches.
Experiment 4: Valuing Defenders
Lastly, the authors focus on valuing defenders by applying the model to all defensive actions and calculating the overall defender score using Equation 4. To validate the results, the top 25 center backs, full backs, and defensive midfielders are selected, and their scores are compared with their market values at the beginning of 2019.
The correlation between the overall defender score and market value is analyzed through a scatter plot, where each data point represents a player. The plot includes a regression line that depicts the trend between the two variables. To quantify the correlation, the Pearson correlation coefficient (𝑟) and the corresponding p-value are calculated. The obtained 𝑟 value is 0.533, indicating a positive correlation, while the p-value is 3.37 × 10^−6, suggesting statistical significance.

The positive correlation between the defender score and market value validates the results generated by the model. However, the correlation coefficient is not stronger due to various factors that introduce noise to the data, unrelated to the actual ability and performance of the player. These factors include age, nationality, political factors, current club, and popularity. For instance, a player like Fernandinho is mentioned as an example in the plot. Despite having a high defensive score and being considered a world-class player, his lower market value can be attributed to being 34 years old in 2019 and potentially past his prime.
In summary, Experiment 4 demonstrates that the overall defender score calculated by the model correlates positively with the market value of defenders. The scatter plot and regression line visually depict this relationship. The statistical analysis, indicated by the Pearson correlation coefficient and p-value, further confirms the correlation’s validity. However, it is acknowledged that other factors beyond the model’s scope, such as age and popularity, influence market value and contribute to the variability observed in the correlation.
Model Application to English Premier League
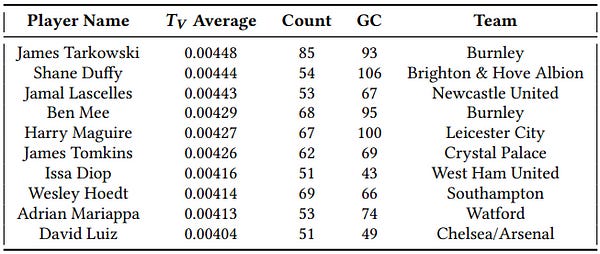
Next, the authors present the results of applying their model to the English Premier League data from the 2017/18 and 2018/19 seasons. They focus on the interception and tackle actions and calculate the Interception Value (IV) and Tackle Value (TV) using their DAxT metric. The results are presented in Tables 3 and 4, which display the combined values for individual players over the two seasons.


The outcomes shown in the tables align with expectations, as the majority of players listed are defenders from teams that finished in the bottom half of the league table. This implies that these players tend to engage in more defensive actions due to their teams having a smaller share of possession in each game. To assess the defensive contributions relative to team possession, the authors suggest normalizing the values based on team possession.
The number of goals conceded (GC) is also provided in the tables, although it is not directly related to the defensive actions. However, it serves as an indicator that committing more defensive actions increases the overall DAxT of defenders, as the cumulative sums in Tables 3 and 4 cover two Premier League seasons.
To identify the players who performed the most crucial defensive actions, the values are further normalized by the total number of defensive actions (DA) committed by each player. Thresholds are set to include only players with more than 100 interceptions and more than 50 tackles, thus filtering out those with limited playing time. The top 10 players with the highest average values for each category are presented in Tables 5 and 6.

During the training of the model, the inputs were standardized. However, an inverse transform function was applied to the outputs to obtain the original corresponding values. This step enhances the interpretability of the results. For example, Fabian Balbuena’s average IV directly corresponds to the fact that his interceptions, on average, prevented actions with an xT value of 0.0031 from occurring.
In summary, it is showcased the application of the model to the English Premier League data, specifically focusing on interceptions and tackles. The results, presented in several tables, demonstrate the defensive contributions of individual players over the two seasons. The normalization and thresholding approaches are utilized to highlight the players with the highest average values in each category. Additionally, the transformation of outputs allows for a more understandable interpretation of the results, providing insights into the impact of individual defensive actions.
Discussion
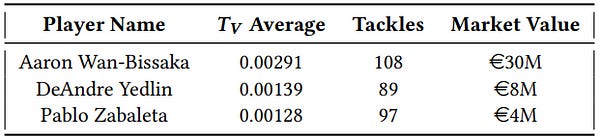
The researchers discuss the advantages of their model, particularly its ability to compare defensive players against each other. They provide two examples, N’Golo Kanté and Aaron Wan-Bissaka, who are both world-class players known for their respective defensive abilities: intercepting and tackling. The researchers identify players with similar numbers of defensive actions as Kanté and Wan-Bissaka and compare their defensive values and market values.
Tables 7 and 8 present the comparisons, showing the average Interception Value (IV) and Tackle Value (TV) per interception and tackle, respectively, as well as the market value of the players at the beginning of 2019. It is observed that the IV and TV are directly proportional to the market value, with Kanté and Wan-Bissaka having significantly higher market values compared to the other players. This analysis demonstrates the value of the model in understanding the underlying factors that contribute to the defensive abilities of benchmark players and their market value, beyond simply comparing the raw numbers of interceptions and tackles.
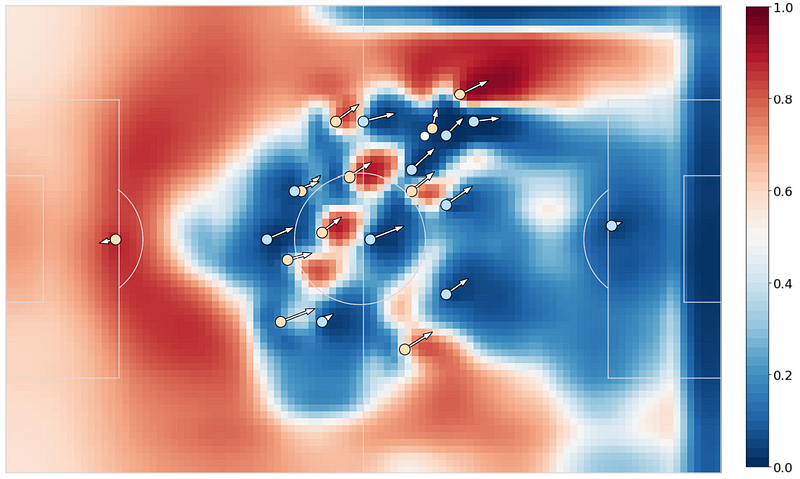
To ensure the logical coherence of the model’s results, the researchers plot the defensive actions of players in each category and color-code them based on their DAxT values. Blue indicates very high DAxT (top 10% in the dataset), followed by green (top 30%), yellow (top 50%), and red (the rest). Figure 5 illustrates the interceptions committed by Fabian Balbuena, where the interceptions closest to the goal (defensively) are shown to have the highest DAxT values. This indicates that these interceptions occurred during passages of play with high threat levels, resulting in increased IV values.

The DAxT values gradually decrease as actions occur further up the pitch, which aligns with the expectation that passages of play in the middle of the pitch are less likely to lead to conceding goals. A similar concept applies to Figure 6, which depicts the tackles committed by Robertson. The tackles that directly resulted in stopping actions of high threat are highlighted in blue, with a majority of the tackles occurring on the left side of the pitch due to Robertson’s position as a left back.

Overall Defender Score
The researchers also discuss the application of the overall defender score for ranking defenders. They filter the rankings based on the players’ positions (center back or full back) and compare their results with the rankings from CIES Football Observatory and InStat Performance Index for the 2019 season. The researchers also consider additional variables such as the number of goals conceded, appearances, goals conceded per appearance, and assists for full backs.
Table 9 presents the rankings for center backs, while Table 10 displays the rankings for full backs. Despite a season difference, there are notable similarities in player standings between the researchers’ rankings and the external studies, suggesting the logical consistency of the results. Furthermore, the researchers find alignment between their defender score and other variables. For instance, among the top full backs, 5 out of 6 have a low average of goals conceded per appearance and a high number of assists compared to the rest. The researchers also highlight examples like Harry Maguire and Nathan Aké, who have a high number of goals conceded per appearance due to their respective teams but also commanded high transfer fees, indicating their recognition and value in the rankings.


The researchers emphasize the advantages of valuing defenders based on different playing styles. Teams can use the same metrics but assign different weights according to their specific needs. For example, relegation-threatened teams may prioritize certain defensive metrics and adjust the weights accordingly. Additionally, the same defender score can be applied to defensive midfielders, as demonstrated in Table 11, which showcases the top 10 defensive midfielders based on the score.

Remaining Challenges
Moreover, the authors discuss the remaining challenges associated with their DAxT model. One limitation identified is that certain defensive actions may be undervalued due to unique passages of play. For example, if a defender intercepts the ball during a counterattack where the opposition has a numerical advantage (e.g., 3 attackers vs. 1 defender), the model may not highly reward this action because similar situations are typically not considered high-threat scenarios. To address this limitation, future research should focus on incorporating tracking data to assess the off-ball contributions and movement of defenders. Techniques like pitch control models, evaluations of opposition marking, and predicting stopping events before they occur can enhance the valuation of defenders’ contributions. However, the availability of comprehensive tracking data across different leagues remains limited, making it crucial to develop smarter methods for valuing defensive actions using event data.
Another challenge mentioned is the dependence of the DAxT model on another player metric, Expected Threat. This dependency poses interpretational issues, as understanding Expected Threat becomes a prerequisite for comprehending the DAxT model. Metrics such as Possession Adjusted Interceptions and True Tackle Win % are comparatively more intuitive than the researchers’ ratings, making it challenging for less analytically inclined scouts to fully grasp the model’s implications.
Conclusion
The authors acknowledge the difficulty in comparing their model to other baseline models due to the scarcity of similar work in the field. They highlight a related study that utilizes tracking data to analyze the defensive impact of players.
In summary, the research paper introduces a novel model for valuing defensive actions by employing deep learning techniques to predict the outcome of future events that defensive actions prevent. The authors propose a new metric called DAxT, which focuses on the values of tackles and interceptions performed by defenders. This model has the potential to enhance clubs’ understanding of defenders’ contributions and aid in the identification of new talent for recruitment across more than 100 leagues where event data is available.
Overall, the research paper contributes to the field by introducing an innovative approach to valuing defensive actions and emphasizes the practical implications of the model for professional clubs in the evaluation and recruitment of defenders.
References
Merhej, C., Beal, R. J., Matthews, T., & Ramchurn, S. (2021, August). What happened next? Using deep learning to value defensive actions in football event-data. In Proceedings of the 27th ACM SIGKDD Conference on Knowledge Discovery & Data Mining (pp. 3394–3403). https://arxiv.org/pdf/2106.01786.pdf