How to Evaluate Player Performance Under Pressure in Football?
A Novel Player Pressure Map for Understanding Player Behavior in High-Pressure Situations.

1. Introduction
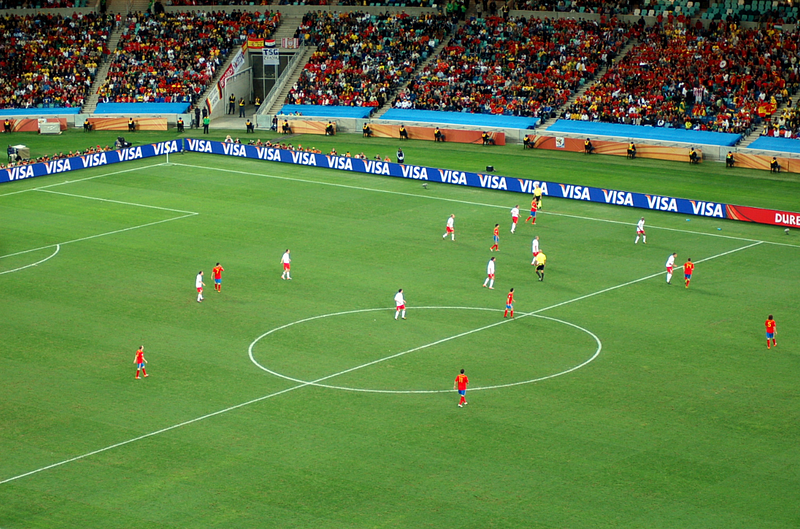
According to the research paper “Player Pressure Map - A Novel Representation of Pressure in Soccer for Evaluating Player Performance in Different Game Contexts”, high pressing has gained popularity as a defensive tactic among elite soccer teams such as Manchester City F.C. and Liverpool F.C. As the authors explain, the primary objective of high pressing is to apply significant pressure in the final third, forcing opponents to make errors. When executed effectively, this tactic provides defending teams with an advantageous scoring opportunity during the transition. Notably, high pressing is also adopted by smaller teams, such as Girona F.C., as it does not require exceptional individual skills but rather cohesive team movement and coordination.
The widespread adoption of high pressing in modern football has increased the importance of assessing a team's ability to handle such pressure. While several studies have analyzed pressure in football, no standardized approach to quantifying it has been established. For instance, Taki et al. measured pressure by evaluating distances between players and the ball but relied on subjective definitions of pressure without considering contextual factors. Andrienko et al. enhanced this approach by integrating directional information of the pressing player and target, though their calculations did not incorporate player body orientation, a key determinant of pressure.
Current pressure quantification methods face two significant limitations. First, subjective definitions, such as the proximity between the pressing player and the ball carrier, introduce potential inaccuracies. Second, these approaches often overlook critical contextual factors, including the body orientation of players. Team-level pressure quantification methods typically aggregate individual player measurements but fail to consider other crucial elements, such as disruptions in passing connections.
The research addresses these gaps by proposing a novel pressure matrix that incorporates rich contextual data, including defensive control probabilities and the body pose of the ball carrier. Additionally, the Player Pressure Map (PPM) is introduced as a graph-based representation of team pressure, integrating individual and contextual information. PPMs are used to generate unique embeddings for specific game scenes, facilitating meaningful pattern recognition by machine learning models. Using Graph Neural Networks (GNNs), a possession outcome prediction model is trained with PPM sequences as input. The resulting predictions quantify the likelihood of the attacking team losing possession, thereby serving as a pressure metric.

The contributions of this research include:
Proposing a novel method to quantify individual player pressure using tracking and event data along with match footage.
Developing the Player Pressure Map (PPM) as a comprehensive representation of team pressure.
Introducing a possession outcome prediction model to effectively quantify team pressure.
2. Methodology
2.1. Model Architecture
To achieve accurate pressure quantification for teams and individual players, the study proposed a machine learning framework. For each timestep, tracking and event data were used to generate a defensive pitch control matrix, while video footage provided players' body motion parameters. A pressure matrix for each attacking player was derived from the pitch control matrix and fine-tuned with body motion parameters. The pressure matrix served dual purposes: quantifying individual player pressure and constructing Player Pressure Maps (PPMs).
PPMs were designed as graphs integrating positional, velocity, and contextual information for a given game scene. These graphs were input into a Graph Neural Network (GNN) to train a possession prediction model. The GNN’s output quantified team pressure by predicting the likelihood of possession loss.

2.2. Dataset
The study utilized tracking and event data along with broadcast video footage from nine Premier League matches. Only active plays were analyzed, with stoppages and set pieces excluded. Despite the limited dataset, the study reported sufficient data to train the models effectively.
2.3. Player Pressure Quantification
To measure individual pressure, the pitch control function was applied to calculate the probability of defensive control at various pitch locations. A “pressure circle” with a diameter of 1 meter was centered around the attacking player’s position, and pressure values were calculated from eight surrounding directions to create the player’s vanilla pressure matrix.

2.3.1. Player Orientation Extraction

Player body orientation, a key contextual factor, was extracted using a top-down approach. Bounding boxes were identified for each player in broadcast footage, and their 3D poses were estimated. By correlating this data with tracking and event datasets, the ball carrier (passer) was identified. Orientation data was refined through tracking models, enabling accurate identification and smoothing of 3D poses across sequences.
2.3.2. Individual Pressure Matrix Fine-Tuning

Using body orientation data, the vanilla pressure matrix was fine-tuned to emphasize directional pressure impacts. Observations revealed that pressure from the front and right of a player’s body orientation had greater influence on passing outcomes. A pressure amplifier based on passing data was applied to adjust the matrix, ensuring accurate representation of spatial and contextual factors.

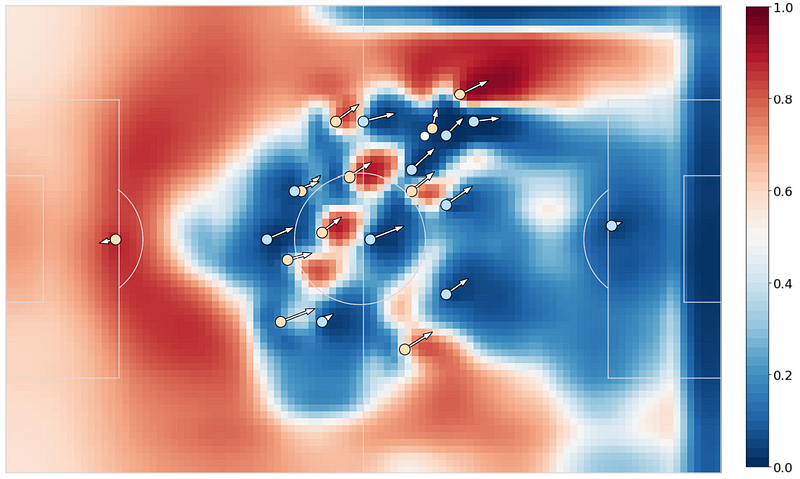
2.4. Player Pressure Map (PPM)
PPMs represented game scenes as graphs with 11 nodes for attacking players and edges capturing distances and angles between players. Unlike previous graph-based football analytics, PPMs embedded defending players’ contextual information into nodes through pressure vectors, preserving critical features while maintaining graph simplicity. The inclusion of 3D contextual factors further enhanced the PPM’s representation.

2.5. Team Pressure Quantification
A Possession Outcome Prediction (POP) model was developed to estimate team-level pressure. POP predicted the likelihood of possession loss within four seconds, with higher loss probabilities indicating greater pressure. Two-second possession sequences were converted into 50 PPMs, which served as input for a GNN. The model architecture included three Graph Convolution Layers, ReLU activation, global mean pooling, and dropout layers, culminating in a fully connected layer for binary classification of possession outcomes.
3. Results
To evaluate the model’s performance, the authors compared the prediction accuracy of two benchmarks against their proposed model. The test dataset comprised one independent Premier League match from the same season, containing over 750 possessions not used during training. Prediction accuracy, defined as the success rate of possession outcome prediction, was calculated for all three models.

The first baseline model, trained solely on tracking data, achieved an accuracy of 55.8%. The second benchmark model, incorporating 2D Player Pressure Maps (PPMs), demonstrated a significant improvement, achieving 75.2% accuracy. This improvement highlighted the limitations of solely using tracking data, as it fails to capture the complex contextual dynamics of football matches. The proposed 3D PPM model further enhanced accuracy to approximately 78%, benefiting from the inclusion of additional 3D features derived from broadcast videos.

While not all 3D features were incorporated, the study emphasized the importance of these features in improving pressure metrics and their potential to enhance tracking data applications in sports performance analysis. For instance, the case illustrated in Figure 9 demonstrated how team pressure metrics responded to dynamic game situations, such as tackling, passing, and switching play directions. The proposed method quantitatively captured pressure intensity at the team level, complementing visual assessments from broadcast footage.
4. Discussion
4.1. Player Performance Under Different Levels of Individual Pressure
The method proposed for quantifying individual player pressure allowed the researchers to evaluate passing accuracy across various pressure levels. Results showed that midfielders consistently faced higher pressure than defenders or attackers but exhibited better consistency in passing accuracy. Conversely, attackers displayed lower passing accuracy under all pressure levels due to their frequent entrapment in compact defensive setups.

By analyzing two players with over 300 passes each, the study highlighted differences in pressure-handling abilities. While both players had similar overall passing accuracies (approximately 80%), Player 184341 demonstrated superior consistency across all pressure levels compared to Player 225796, who performed poorly under high-pressure scenarios. These findings align with their real-life roles, with Player 184341 excelling as an attacking midfielder and Player 225796 being an average defensive midfielder. The study concluded that incorporating pressure metrics provides a more accurate evaluation of player performance.
4.2. Player Performance Under Different Levels of Team Pressure
Using the possession outcome prediction model, the researchers quantified team pressure during match sequences and assessed player performance in relieving pressure. The analysis identified Player 41328 as the most effective dribbler, reducing team pressure by approximately 0.4 per dribble, while Player 38533 was the most efficient passer. The combined performance of passing and dribbling indicated that Player 41328 was the most effective overall in mitigating opponent pressure.

The study emphasized the practical applications of this method for coaching staff, enabling data-driven evaluations of player contributions and the identification of ineffective plays. These insights can guide tactical adjustments and enhance player performance under pressure.
5. Conclusion
This study demonstrated the feasibility of quantifying individual and team-level pressure using a novel framework that integrates tracking data, event data, and broadcast footage. The proposed Player Pressure Map (PPM) and possession outcome prediction model effectively captured contextual and spatial factors, offering valuable metrics for sports performance analysis.
The results highlighted the importance of 3D features in improving pressure metrics and player evaluations. By incorporating pressure considerations, the evaluation of passing and dribbling abilities became more robust and accurate, aiding coaching staff in decision-making and providing scouts with deeper insights into player capabilities.
Future work could focus on expanding the temporal scope of input data using models like Long Short-Term Memory (LSTM) networks to improve performance further and explore new dimensions of contextual information.
References
Gu, C., Na, J., Pei, Y., & De Silva, V. (2024). Player Pressure Map-A Novel Representation of Pressure in Soccer for Evaluating Player Performance in Different Game Contexts. https://www.sloansportsconference.com/research-papers/player-pressure-map---a-novel-representation-of-pressure-in-soccer-for-evaluating-player-performance-in-different-game-contexts