


Quantifying the Intensity of High-Press Tactics in Football with PPDA
Unveiling the hidden patterns and quantifying the effectiveness of high-press defensive strategies in football through advanced metrics.

Introduction
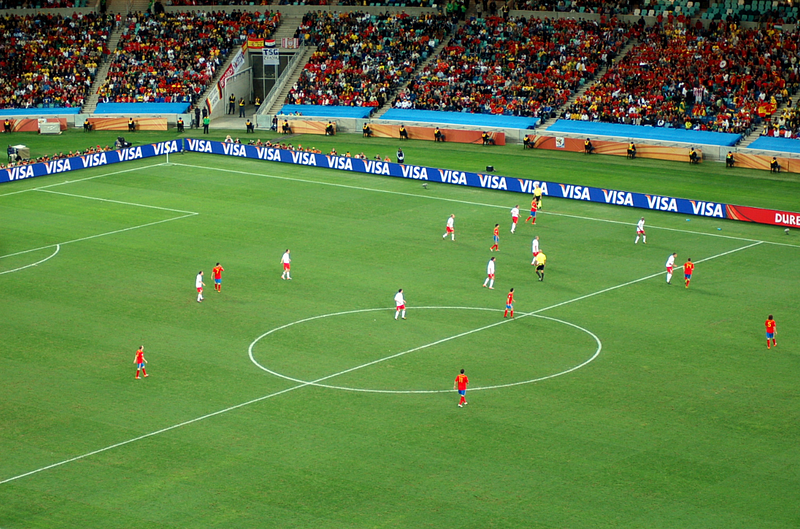
The article “Defensive Metrics: Measuring the Intensity of a High Press” was published on 2014 by Colin Trainor in the StatsBomb website. It delves into the development of a defensive metric called Passes Allowed Per Defensive Action (PPDA) as a means to measure the extent and aggression of high presses in soccer matches. The author aims to establish a quantifiable measure that captures the intensity of a team’s pressing strategy over the course of a season or within a specific match, leveraging detailed Opta data.
By utilizing Opta’s event records, the author seeks to devise a metric that reflects the pressing intensity based on the number of passes allowed by the defending team before they initiate a defensive action. This concept revolves around the idea that a higher PPDA value indicates a more aggressive and intense pressing approach, as it signifies that the defending team quickly engages their opponents to disrupt their passing sequences.
Quantifying Pressing Intensity: Benefits and Applications
This section explores the motivations behind developing an objective scale to measure the intensity of a press in soccer. The author emphasizes that undertaking such analytics studies provides valuable insights and benefits for coaches, teams, and fans. By creating a quantifiable measure, coaches can quickly assess the strength of the high pressing employed by their opponents in recent games, enabling them to devise appropriate counter-strategies.
Additionally, teams and fans can evaluate the amount of pressure their own team exerted on the opposition in deep positions. This allows for a better understanding of the team’s defensive effectiveness and provides a basis for analyzing defensive performance over time. Moreover, the potential for assessing the individual impact of players on their team’s pressing ability opens up avenues for evaluating player contributions and making data-driven decisions regarding team selection and tactical adjustments.
The development of an objective scale, such as the Passes Allowed Per Defensive Action (PPDA) metric discussed earlier, reduces the subjective nature of describing pressing intensity to a single numerical value. This facilitates comparison, analysis, and ranking of teams’ pressing strategies, enabling a more comprehensive understanding of defensive dynamics. Coaches, analysts, and fans can utilize this quantifiable measure to gain insights into team performance, make informed decisions, and enhance strategic planning.
Defining Defensive Actions for Quantifying Pressing Intensity
This section focuses on the selection and definition of defensive actions for the purpose of quantifying pressing intensity using the Passes Allowed Per Defensive Action (PPDA) metric. The author identifies four Opta-defined events, namely tackles, interceptions, challenges (failed tackles), and fouls, as the key defensive actions to be considered in this analysis.
The primary objective of this analysis is to measure the pressure exerted by the defending team on the opposition players when they are in possession of the ball. Therefore, the author emphasizes that the focus is on capturing the defensive aspects rather than the opposition’s passing behavior. By considering these four defensive actions, the author believes that an adequate representation of defensive pressure can be achieved.
It is important to note that, at this stage, the aim is to develop a descriptive measure of pressing intensity, and the success or failure of the press is not the primary concern. Instead, the author seeks to establish a foundation for quantifying the pressure exerted by the defending team. By adopting this approach, the analysis can provide insights into the defensive strategies and behaviors of teams without delving into the outcome or effectiveness of the pressing actions.
The PPDA metric is then introduced as a calculation derived from the number of passes allowed by the defending team and the total number of defensive actions performed. Both of these values are determined within a specific area of the pitch, allowing for a more contextualized assessment of pressing intensity. By dividing the passes allowed by the defending team by the total defensive actions, the PPDA metric offers a quantitative measure that reflects the defensive pressure exerted by a team in a particular region of the pitch.
PPDA = Number of Passes made by Attacking Team / Number of Defensive Actions
Interpreting PPDA Values: Assessing Defensive Intensity
This section focuses on interpreting the values of the Passes Allowed Per Defensive Action (PPDA) metric as a measure of defensive intensity. A smaller PPDA value is associated with a higher level of defensive intensity, indicating that the defending team has allowed a smaller ratio of uncontested passes to be made by the opposition.
The author acknowledges that not all pressing teams engage in constant pressing throughout the game. Some teams may employ specific triggers or cues to initiate their pressing actions, rather than pressing solely based on the position of the ball. Despite these variations in pressing strategies, the PPDA metric remains an objective measure as it calculates the defensive team’s pressing intensity by considering all opposition passes within the specified area of the pitch.
The PPDA metric offers a comprehensive and contextualized assessment of defensive intensity by taking into account the number of uncontested passes allowed. A smaller PPDA value suggests that the defending team actively disrupts the opposition’s passing sequences more frequently, displaying a higher level of defensive pressure. Conversely, a larger PPDA value indicates a lower defensive intensity, as the defending team allows a higher proportion of uncontested passes.
By incorporating the calculation of PPDA within the specific area of the pitch, the metric captures the spatial aspect of pressing intensity. This approach recognizes that different areas of the pitch may require varying defensive strategies and allows for more nuanced analysis of defensive behaviors within different zones.
Determining the Pitch Area for Measuring Pressing Intensity
This section addresses the crucial decision of selecting the specific area of the pitch for measuring the intensity of pressing. The author acknowledges that there may not be a definitive right or wrong answer to this choice but sought input from Rene Maric of the Spielverlagerung tactics-focused site to inform the decision-making process. Ultimately, both the author and Maric settled on the area of the pitch with an x-coordinate greater than 40, as defined by Opta.
The perspective used in this analysis is from the viewpoint of the team playing from left to right, with the goal to the left. The defensive actions (tackles, interceptions, challenges, and fouls) considered are those occurring to the right of the line represented by “x = 40”. This includes defensive actions in a team’s attacking half as well as a small portion of their own defensive half.

Moving forward, all Passes Allowed Per Defensive Action (PPDA) values pertain to “PPDA Beyond40,” which refers to the metric exclusively utilizing defensive actions and opposition passes that occurred beyond the x = 40 line. This boundary serves as the basis for assessing the intensity of high pressing by the defending team.
Determining the Boundary for Pressing Metric
This section discusses the rationale behind selecting the value x = 40 as the boundary for the pressing metric. The author explains their decision-making process and justifies why other potential boundaries (x = 33 and x = 50) were not chosen. The goal is to identify a boundary that accurately captures the intensity of a team’s pressing while considering practical football aspects.
The author acknowledges the possibility that a team may strategically concede possession in the opposition half but apply pressure once the ball crosses the halfway line. By using x = 40 as the boundary, such teams receive credit for the pressure they exert as soon as the ball enters their own half. This boundary strikes a balance between recognizing defensive pressure and avoiding including actions in the defensive third of the pitch, as it would be expected for teams to make tackles and challenges in that area.
To validate the chosen boundary, the author performs a correlation analysis by comparing the pressing metric values (PPDA) at different potential boundaries (x = 33, 40, and 50). The analysis reveals a high degree of correlation between all the potential cutoff values, with correlation coefficients (r²) of 0.84 between x = 33 and x = 40, and 0.81 between x = 40 and x = 50. This indicates that the pressing metric at x = 40 explains more than 90% of the variation in the metric at each of the other potential boundaries.
Overall, the decision to use x = 40 as the boundary for the pressing metric is supported by both practical football considerations and the strong correlation observed with other potential boundaries. This choice provides a meaningful approximation of how teams press and ensures the metric accurately reflects the intensity of defensive actions, regardless of the exact cutoff value employed. The logical analysis underscores the importance of selecting an appropriate boundary for the pressing metric to capture the desired aspects of defensive pressure.
Insights from Southampton’s Pressing Intensity
This section examines the PPDA values and their implications for assessing pressing intensity, focusing on the example of Southampton Football Club. The author highlights the impact of Mauricio Pochettino’s management on Southampton’s pressing game and analyzes the team’s PPDA values over the course of two seasons.
To mitigate game-to-game variations, the author presents the PPDA values using a 6-game rolling average. It is crucial to note that a lower PPDA value indicates a higher level of pressing intensity by the defending team.
Under Nigel Adkins’ leadership, Southampton exhibited a 6-game rolling average PPDA ranging from just under 10 to 14. However, the arrival of Pochettino marked a significant shift. Southampton’s PPDA value experienced a noticeable and consistent decrease during their first six games under Pochettino, resulting in a rolling 6-game value of less than 8. This trend continued throughout the 2012/13 season, indicating the team’s sustained high level of pressing.

Interestingly, the data suggests that Southampton’s pressing intensity declined in the latter half of the 2013/14 season compared to Pochettino’s first year in charge. The rolling PPDA value at the end of the 2013/14 season was even higher than when Adkins left the club in January 2013. The author speculates that Southampton’s drop-off in intensity might be attributed to having “nothing to play for” in the final few games. However, it is worth noting that Southampton’s decreased pressing intensity during this period was not widely acknowledged or reported.
The author highlights a particularly uncharacteristic performance by Southampton against Cardiff City, where their PPDA figure reached 14.5. This marked a departure from their usual pressing intensity and had a tangible impact on the match result, with Cardiff securing a 1–0 away win, only their second away victory of the season. The lack of aggression in attempting to regain possession likely contributed to Southampton’s defeat.
Barcelona’s Defensive Pressing Transition: A Managerial Influence
This section focuses on the transition of Barcelona’s defensive pressing approach after Pep Guardiola’s tenure and examines the impact of Tito Vilanova’s management on the team’s defensive strategies. The rolling 6-game average Pressing Score (PPDA) for Barcelona over four seasons is presented, revealing notable changes in defensive intensity.
During Guardiola’s reign, Barcelona maintained a consistent PPDA range of 6–9, reflecting their commitment to high-intensity pressing. However, with Vilanova taking charge, the team’s PPDA value started to rise, indicating a shift in defensive approach. Barcelona appeared to deviate from their previous style of play when out of possession.
Unfortunately, Vilanova’s managerial tenure was cut short due to his health issues, and it became evident that Barcelona began reverting to the game plan employed under Guardiola as soon as Vilanova was admitted to the hospital during the 2012/13 season. The rate at which Barcelona reduced their PPDA metric after Game number 91 in the season is described as remarkable, signifying a significant shift in their defensive mindset. It is suggested that either Vilanova had a tactical rethink during his period of convalescence or Jordi Roura took charge of the team’s tactics. Considering the substantial differences in PPDA values, the latter option seems more plausible.

The presented Barcelona plot demonstrates the impact of a manager on a team’s pressing intensity, regardless of the players involved. It showcases the potential for managers to shape defensive strategies and highlights the motivation behind measuring defensive metrics. Just as attacking strategies can be quantified using statistical measures, there is a compelling reason to strive for similar quantification in the defensive aspects of the game.
Pressing Intensity Across Leagues: A Comparative Analysis
This section explores the variation in pressing intensity observed across different leagues. It emphasizes that the decision to employ pressing tactics largely lies with the managers or coaching staff, suggesting that teams are capable of adapting their playing style accordingly. The analysis aims to uncover trends and potential factors influencing the prevailing tactics in each league.
Examining data from 20 leagues and seasons, it is revealed that the 2013/14 English Premier League (EPL) season had the highest PPDA value, indicating a lower level of pressing compared to other leagues. This finding suggests that the high-pressing style adopted by Mauricio Pochettino’s teams, as exemplified in previous examples, is not the norm in the Premier League.

Interestingly, the analysis also highlights that the three seasons with the highest levels of intense pressing occurred during the 2011/12 season. This prompts speculation regarding whether this observation is a result of small sample sizes or if it aligns with the influence of Pep Guardiola’s Barcelona and their renowned “tiki-taka” style of play. While it is uncertain whether this correlation is coincidental, it is worth noting that the PPDA values in the 2013/14 season across all leagues were relatively high, suggesting a potential decline in the dominance of pressing as a defensive tactic compared to the recent past.
The findings imply that there are dynamics at play that influence the prevalence of pressing across different leagues. Factors such as managerial philosophies, playing styles, and tactical trends may contribute to the varying levels of pressing intensity observed. Further research is required to gain a deeper understanding of these factors and their impact on defensive strategies in different leagues.
Pressing Analysis: 2013/14 Premier League Season
This section examines the pressing dynamics in the 2013/14 Premier League season. The analysis focuses on the spread PPDA values across the twenty teams in the league, shedding light on the defensive strategies employed by each team.
Notably, Southampton emerged as the team with the strongest pressing value in the Premier League during that season. Their proactive approach to pressuring the opposition is evident from their impressive PPDA value. Conversely, teams situated on the right side of the chart exhibited a lack of pressing in deep positions. These teams seemed content with conceding possession in the opposition half and prioritizing defensive organization closer to their own goal.

Despite the influence of foreign coaches and exposure to continental tactics, a significant number of Premier League managers and coaches still adhered to the traditional English defending approach of getting men behind the ball.
These findings suggest a division in defensive strategies within the Premier League, with some teams embracing a proactive pressing style while others favor a more conservative and defensive approach. The coexistence of these contrasting tactics highlights the diversity of approaches in English football and the preferences of different managers and coaches.
Exploring Defensive Metrics Beyond the High Press
The focus of this article was to develop a method for defining and measuring the intensity with which teams employ the high press to regain possession in advanced areas of the field. However, it is acknowledged that the high press is not the sole defensive strategy used in football. The author expresses an intention to explore and develop metrics for measuring and defining other defensive systems employed by coaches and managers. The aim is to provide a comprehensive understanding of different defensive approaches in football.
This article set the stage for future research and analysis, recognizing the need to go beyond the high press and develop a broader framework for evaluating various defensive systems. By expanding the scope of defensive metrics, the author sought to contribute to the understanding of defensive strategies and their impact on team performance.
References
Trainor, C. (2014, July 30). Defensive Metrics: Measuring the Intensity of a High Press. Retrieved from https://statsbomb.com/articles/soccer/defensive-metrics-measuring-the-intensity-of-a-high-press/


