Pass Quality Assessment in Soccer: A Multi-Dimensional Approach with Continuous Evaluation
A novel approach to measure the quality of soccer passes on a continuous spectrum and estimate both the risk and reward across tracking…

Introduction
The introduction of the research paper highlights the importance of passing in soccer and the need for better measures to capture the risk and reward associated with different passing options. The authors reference Pep Guardiola’s emphasis on passing with intention and creating imbalances between attack and defense. They note that current passing measures, such as pass completion, fail to capture the varying levels of risk and reward involved in different passing situations.
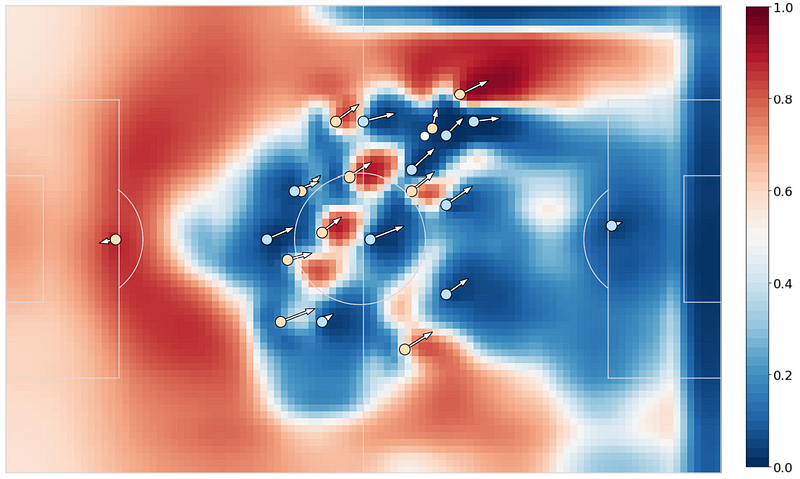
The authors present a snapshot of play where a pass to one player (Costa) is riskier but more likely to lead to a shooting chance compared to a pass to another player (Fabregas). They argue that assigning both passes the same weight in current passing metrics is problematic for team and player analysis. They propose a better alternative that considers both the likelihood of executing a pass (risk) and the likelihood of creating a scoring opportunity (reward). They provide an example illustrating how such a metric could be useful in analyzing pass quality based on difficulty and the probability of a shot occurring.

To estimate the risk of a pass, the authors discuss two potential approaches: human-labeled and event-outcome labeled. The human-labeled approach involves assigning quality ratings to passes by human experts, while the event-outcome labeled approach optimizes an objective function based on pass outcomes. The authors argue that the event-outcome labeled approach is preferred as it avoids subjectivity and allows for scalability across different teams. They also highlight that this approach enables the measurement of pass reward by correlating it with concrete events like shots on goal.

The paper aims to demonstrate how the risk and reward of a pass can be objectively measured using player tracking and ball event data. The authors emphasize the applications of their system across various use cases, showcasing the potential for improving passing analysis and decision-making in soccer.
Related Work
In the “Related Work” section, the research paper discusses previous studies and methodologies related to measuring passing quality in soccer. While there is a lack of large publicly available datasets for researchers to compare ideas and methods, some data has been made accessible through vendors, leading to recent advancements in soccer analysis.
The majority of works in this field have primarily relied on ball-event data, as it has been the most common form of available data. Notable studies include Lucey et al., Gyramati et al., and Wang et al., which have used aggregated methods to identify characteristic playing patterns of teams and analyze passes and team-play. Brooks et al. have developed a player ranking system based on the value of completed passes.
Regarding the direct measurement of passing quality using supervised learning, Horton et al. employed domain experts to assign ground truth labels of good, OK, and bad for passes, training a model to classify passing quality. This approach was inspired by the work of Taki and Hasegawa, who measured the dominant region of a player to model the probability of intercepting the ball. The issue of conflicting agreement among the experts creating the training labels was noted.
Link et al. crafted a set of features using spatial-temporal data to measure the dangerousness of a pass in the attacking third of the pitch. McHale et al. used a generalized additive mixed model to measure the probability of completing a pass while considering the random effects of the team and player. Gyramati et al. proposed a “QPass” method to quantify the quality of a pass. In basketball, Cervone et al. introduced a model to capture “expected possession value” and assess how a player’s decision impacts the team’s scoring chances.
However, most of these methods do not fully account for the game and team context due to the absence of tracking data that captures these crucial cues. The paper under discussion aims to advance the understanding of the game by incorporating this additional contextual information, offering new insights into measuring passing quality and its effects.
Measuring Pass Risk and Reward
Data Inventory
The researchers utilized ball event data and player tracking data from English Premier League games spanning the 2014/15–2015/16 seasons, which included a total of 726 matches. The data consisted of player trajectories with X and Y locations sampled at 10Hz, time stamps, player names, team names, and match names. The event data files contained information such as event names (e.g., pass, shot, tackle), ball positions (origin and destination), ball time stamps, team and player in possession, match names, and details of the opposing player involved in dual situations like tackles or headers.

Focusing specifically on passes within the sample, there were a total of 571,287 pass attempts, out of which 468,265 were successful. On average, 380.46 passes were attempted and 320.91 passes were completed per game, resulting in a pass completion rate of 84.35%. The breakdown of pass types is presented in Table 1. The data shows that backward and sideways passes were more common and had higher success rates (95.78% and 93.03%, respectively) compared to forward passes (72.28%). As passes approached the opponent’s goal, the success rate decreased, with forward passes in the attacking third successfully completed 58% of the time and passes into the penalty area completed 37% of the time. These findings highlight the need to consider the context of each pass to accurately measure its risk.
The data inventory establishes the foundation for analyzing pass risk and reward in the subsequent sections of the paper, providing a comprehensive dataset from English Premier League matches that captures the various pass types and success rates at different areas of the pitch.
Defining Pass Risk
The authors then explain their approach to defining and estimating the risk of a pass. They define pass risk as the likelihood of successfully completing a pass given a player’s possession of the ball and the situation they are in. To estimate this risk, they employ a standard supervised learning pipeline, training a classifier to output a probability between 0 and 1 based on input features describing the game situation.
To establish baselines for comparison, the authors consider three feature representations: Naive, Ball-Information, and Tracking/Feature-Crafted. The Naive baseline assigns the average pass completion rate (85%) to all passes. The Ball-Information baseline utilizes the starting and end positions of the pass. The Tracking/Feature-Crafted baseline incorporates player trajectory data and introduces soccer-specific features referred to as Micro Features. These features capture coaching points that influence the likelihood of pass completion and model the relationship between the main players involved in the pass.
The Micro Features include:
1. Speed of the player in possession and the intended receiver.
2. Speed of the nearest defender approaching the passer and the receiver.
3. Distance of the nearest defender to the passer and receiver.
4. Angle of the nearest defender to the passing line.
5. Whether it is a first-time pass (pass on the first touch) or not.
6. Time elapsed since regaining possession.
Building upon the work of McHale et al., the authors introduce an additional feature called the “intended receiver.” They improve the initial model by considering the angle of the potential receiver in relation to the passing line. This information helps identify the most likely player to receive the pass. The expected receiver is determined using a formula that incorporates distance and angle measurements.

The limitations of this simple model are acknowledged, particularly in scenarios where players are close to each other or the ball is intercepted early. Additionally, the model assumes the absolute position of the expected receiver and does not predict the ball’s intended location (e.g., playing a pass in front of the attacker to run onto).
For classification purposes, the authors employ a logistic regressor as the chosen classifier. They prioritize interpretability, as it is crucial for coaches to understand the factors driving passing performance. The coefficients of the logistic regressor serve as coaching points, providing insights into the importance of different features. The model is trained on 352,466 examples and tuned using an evaluation set consisting of 114,257 examples. The positive examples represent successfully executed passes, while the negative examples represent unsuccessful passes.
By utilizing these approaches, the authors aim to effectively define and estimate pass risk, taking into account various game situations and incorporating interpretable features that capture critical factors influencing pass completion.
Defining Pass Reward
The next focus is on defining and estimating the reward of a pass. They define pass reward as the likelihood that a pass made in a given situation, with a player in possession of the ball and the ability to pass, will result in a shot within the next 10 seconds. To estimate this reward, a similar supervised learning approach is employed as in the previous section.
Instead of using the labels of successful and unsuccessful passes, the authors use labels indicating whether a shot occurred within 10 seconds of the pass or not. The choice of a 10-second window is based on previous literature and is a heuristic commonly used by coaches in practice to analyze shot outcomes.
One challenge in training the classifier for pass reward estimation is the sparsity of shots. Positive examples (shots occurring within 10 seconds) are significantly outnumbered by negative examples (no shot within 10 seconds). In the training set, there were 7,427 positive examples and 136,180 negative examples, while the test set consisted of 3,062 positive examples and 58,484 negative examples. The performance of the classifiers is presented in the right columns of Table 2, showing that using tracking data achieves the best performance among the different feature sets.
By defining and estimating pass reward, the authors aim to provide insights into the likelihood of a pass resulting in a shot within a specific timeframe. This information can help analyze the effectiveness and potential impact of different passes, contributing to a deeper understanding of offensive strategies and decision-making in soccer.

Incorporating Context
Learning Context Directly from Data
The next step is incorporating contextual information to improve the analysis of passes. The authors highlight the significant variation in passing execution rates based on the context in which the pass is made. While micro-level features derived from tracking data provide some context, capturing high-level contextual information at the team level can enhance predictions and provide valuable insights for coaches.
The authors propose a tree structure approach, where the crafted passing dictionary represents leaf nodes. This approach aims to capture both tactical features (game-state) and formation features (team structure). Three distinct game-states are considered for analysis: build-up, counter-attack, and unstructured play, as they enable contextualization and linearization of the data, leading to improved risk and reward estimations. Incorporating tactical features alone (tracking + tactics) already shows an enhancement in overall risk and reward prediction.

To further enhance contextual understanding, the authors introduce formation features, which capture the location and spread of players within the team structure. They utilize a formation clustering method to align players to specific roles and describe the formation structure using XY positions of all players for both attacking and defending teams. By calculating polar coordinates of players relative to the goal being attacked, the spatial relationships between different roles and their impact on pass completion chances can be learned. Additionally, the polar coordinates of defenders to the passer and receiver provide insights into defensive positioning.
The defensive block, categorized as high-block, medium-block, and low-block, plays a crucial role in pass type attempted and the associated risk. To label the defensive block, the authors perform k-means clustering on the aligned player and ball data. The inclusion of formation features, along with tracking data, improves the estimation of pass risk and reward.
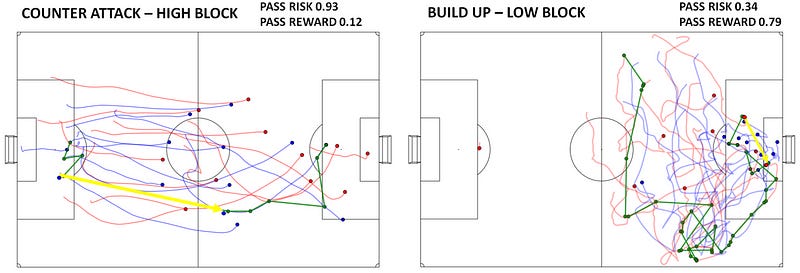
Examples of tactical and formation features are provided to illustrate the proposed approach. One example showcases a counter-attack situation where the possession starts in a high-block, leading to low average passing risk and high average pass reward due to the defenders being out of position. Another example demonstrates a build-up phase in a mid-block, where lateral passes are employed to unlock a highly organized defense. The average pass danger is lower due to the lateral nature of passes, but the skill level required to complete a penetrative pass is higher due to the increased number of defenders in front of the ball.
By incorporating contextual information, including tactical features and formation features, the authors aim to provide a more comprehensive analysis of passes in soccer. This approach enhances the understanding of pass execution, risk assessment, and decision-making, ultimately assisting coaches in optimizing team strategies.
Application I: Game Analysis
Match Analysis
The researchers then discuss the application of the proposed approach to analyze soccer matches. The authors argue that existing match summaries often fail to provide a true understanding of the strategic concepts employed by teams and their execution. They present a case where a basic statistical analysis of passing performance between two teams, Manchester City and Manchester United, does not provide a clear explanation for the outcome of the game. Manchester City had higher possession, more passes, and a higher completion rate, yet Manchester United won 1–0. To gain deeper insights, the authors utilize their pass risk and reward models.

To provide a more comprehensive analysis, the authors introduce two important measures: average pass risk and pass danger (equivalent to pass reward). Pass danger indicates the number of passes made by a team that could potentially lead to shots on goal. Additionally, they define “dangerous pass” as a pass that falls within the top 25th percentile of passes with the highest reward. This threshold is determined based on the training and evaluation set and remains fixed for all games.
By incorporating these measures, a more nuanced understanding of the game emerges. Despite Manchester City playing almost twice as many dangerous passes as Manchester United (131 vs. 72), their passes were generally less risky (14% vs. 17%) and more dangerous (16% vs. 13.5%). These measures allow analysts to gain a sense of how the game is being played, revealing the balance between risk and reward in each team’s passing strategy.
The proposed approach provides a more insightful analysis of match dynamics, moving beyond traditional statistics such as possession and pass completion rate. By considering pass risk, pass danger, and dangerous passes, analysts can evaluate the effectiveness of a team’s passing strategy and assess the impact of their decision-making on the game’s outcome. This advanced analysis allows for a deeper understanding of the strategic concepts employed by teams and their execution, providing valuable insights for coaches, players, and match analysts.

Specific Play Analysis
In this section the authors focus on the analysis of specific plays in soccer, particularly the identification of critical passes that unlock a defense. Currently, these critical passes are subjectively determined by human judges during the game, leading to variability and subjectivity. The authors propose an objective approach to assess the reward of each pass in a play, allowing for an unbiased evaluation of the player responsible for changing the attacking momentum.
The authors present an example play in Figure 8 to illustrate their approach. In the timeline of the play, it becomes evident that although Willian delivers the final assist (key pass), Fabregas played the critical pass that significantly increased the probability of a shot occurring from 0.13 to 0.21. This demonstrates that while Willian’s ability to maintain the ball in a dangerous area is important, Fabregas should be credited for playing the most critical pass in the sequence. By objectively assessing the reward of each pass, the analysis goes beyond capturing the outcome of a possession and focuses on the process that led to the end outcome.

By combining the pass risk and pass reward models, the authors are able to learn a new dictionary of objectively measured dangerous or critical passes. This dictionary provides a valuable tool for identifying and quantifying the impact of specific passes in changing the course of a possession. The proposed approach eliminates the subjectivity associated with manual judgment and allows for a more precise and unbiased assessment of players’ contributions to the attacking momentum.
This analysis of specific plays enhances the understanding of player performance by identifying key moments and attributing significance to individual passes. Coaches, players, and analysts can utilize this objective assessment of critical passes to gain insights into player effectiveness, tactical strategies, and overall team performance.
Application II: Season-Wide Player Analysis
Ranking the Riskiest Players
Following the last application, the authors focus on the season-wide player analysis and introduce two new metrics for evaluating players’ passing performance: Passing Plus Minus (PPM) and Difficult Pass Completion (DP%). These metrics aim to assess the riskiness and difficulty of a player’s passes, respectively, providing valuable insights into their passing abilities.
The authors start by explaining that the pass risk prediction model allows them to estimate the average skill required to complete a pass in a specific context. Based on this prediction, they introduce the PPM metric, which calculates the aggregated credits and penalties for successful and unsuccessful passes. A player who completes a pass with low risk is awarded a positive credit, while an unsuccessful pass incurs a negative penalty. PPM is then normalized per 90 minutes to facilitate comparisons between players. It enables coaches and analysts to identify players who consistently perform above or below the average in terms of completing passes.
The second metric, DP%, focuses on difficult pass completion. A difficult pass is defined as a pass with a high risk of failure, falling within the 75th percentile of the most challenging passes. DP% measures the ratio of difficult passes completed to difficult passes attempted by a player. It provides insights into a player’s ability to attempt and successfully complete risky and difficult passes.
To illustrate the application of these metrics, the authors present a distribution plot in Figure 9 (left) that showcases the passing ability of outfield players who played over 1800 minutes (20 games) in the English Premier League for the 2015–2016 season. The plot shows a positive correlation between PPM and DP%, indicating that players who complete more passes than expected also tend to complete a higher proportion of difficult passes. Notably, creative players such as Cesc Fabregas, Mesut Oezil, and Eden Hazard have the highest PPM and DP% scores, indicating their proficiency in completing both risky and difficult passes. Conversely, Wayne Rooney, despite being a renowned player, demonstrates lower scores in both metrics, suggesting a decline in his passing abilities.

By using PPM and DP% as objective measures of passing performance, coaches and analysts can gain a comprehensive understanding of players’ passing skills, their ability to complete difficult passes, and their overall impact on the game. These metrics provide valuable insights into player rankings and can assist in player selection, tactical planning, and performance evaluation throughout the season.
Ranking of Best Players Receiving Passes
The authors also introduce a new metric called Passes Received Added (PRA) to assess the ability of players to receive high-risk passes effectively. The authors emphasize the importance of having skilled receivers to complete difficult passes successfully.
To calculate PRA, the authors consider only the passes received by a player that fall within the 75th percentile of passing risk, representing the most challenging passes to complete. PRA is then calculated as the complement of the probability of a pass being completed (1 — XDpr). For instance, if a player receives a pass with a 0.4 probability of completion, they are awarded a score of 0.6. If the pass had a weight of 0.2, the receiver would receive a score of 0.8. These scores are summed and standardized to a per 90-minute value. A player with a score of 0 receives the expected number of dangerous passes, while a player with a score greater than 0 receives more dangerous passes than expected.
In Figure 9 (right), which includes outfield players who played over 1800 minutes, the authors present PRA on the Y-axis compared to Passing Plus Minus (PPM) on the X-axis. The plot reveals that tall target players like Rudi Gested and Joshua King, as well as small quick center forwards from highly skilled teams such as Alexis Sanchez and Sergio Aguero, rank highly in this metric. By combining PPM and PRA, the authors introduce the metric Total Passes Added (TPA). TPA represents the sum of PPM and PRA and indicates the extent to which players help their team retain or lose possession compared to an average player. A negative score indicates a higher tendency to lose the ball, while a positive score suggests a greater contribution to ball retention.
The authors use TPA as the bubble size in Figure 9, where gray circles represent players who add passes and white circles represent players who lose passes. By considering PPM, PRA, and TPA together, it becomes possible to assess not only which players contribute or lose passes but also how they do so. For instance, Sergio Aguero and Mesut Özil are shown to complete and receive more passes than the average player, while Rudi Gested and Joshua King complete fewer passes but receive more passes than an average player. On the other hand, Gary O’Neil and DeAndre Yedlin both struggle to complete and receive passes, resulting in a negative impact on their teams.
By combining these three metrics, analysts can gain a deeper understanding of players’ passing contributions and their impact on ball retention. This comprehensive evaluation allows for the identification of players who excel at receiving difficult passes, those who struggle in pass completion, and the overall effect they have on their teams’ possession.
Ranking of Reward Passes
Moreover, the authors focus on ranking reward passes, which assess the impact of passes in creating danger for the opposition. They introduce a pass reward model that measures the likelihood of a shot being created within the next 10 seconds, allowing for the identification of the most dangerous passes. The authors define a Dangerous Pass (DP) as an attempted pass with a greater than 6% chance of leading to a shot. To calculate the Dangerous Passes metric, they sum all the passes attempted by a player within this threshold. The DP metric is then standardized to a per 90-minute value for easy comparison.
To assess the ability of players to receive dangerous passes, the authors introduce a new metric called Receiving Dangerous Passes (RDP). Similar to DP, RDP considers only the passes received by a player that have a greater than 6% likelihood of leading to a shot in the next 10 seconds. The number of these dangerous passes received is counted and normalized per 90 minutes. This metric enables the assessment of players who create and exploit the most dangerous passes.
Figure 10 presents the distribution of all outfield players who played over 1800 minutes for the season. The ordering of players based on the danger of their passes differs from those with high scores in metrics like PPM and TPA. David Silva and Mesut Özil are identified as the most dangerous players in possession of the ball. While attacking players make up the majority of those executing high-reward passes, Alexander Kolarov, a full-back, features prominently in the metric. Additionally, Wesley Hoolahann is ranked 19th for dangerous passes made, which is noteworthy considering Norwich City’s relegation that season. Examining players who receive the most dangerous passes reveals that Alexander Kolarov is again prominent, indicating his ability to both make and receive dangerous passes. This insight is valuable for opposing coaches who may not automatically recognize a full-back like Kolarov as a significant threat to counter.

In addition to analyzing future opponents, these new metrics can also be used to assess potential recruits for a team. For example, a team with a limited budget may not have been aware of Wesley Hoolahan’s effectiveness in playing dangerous passes, and as a result, they could gain an advantage in signing him from a relegated team at a lower transfer fee.
By incorporating metrics for ranking reward passes, teams and coaches can better evaluate players’ abilities to create and exploit dangerous passes, gaining insights for both tactical preparations and potential recruitment strategies.
Application III: Team-Based Analysis
Finally, the research paper focuses on the application of the proposed analysis framework to team-based analysis. With teams playing multiple games per week, coaches require a quick and efficient method to identify and understand the patterns used by opposing teams and assess their level of danger. By assigning risk and reward ratings to each pass and capturing the tactical context, the passing style of a team can now be measured.
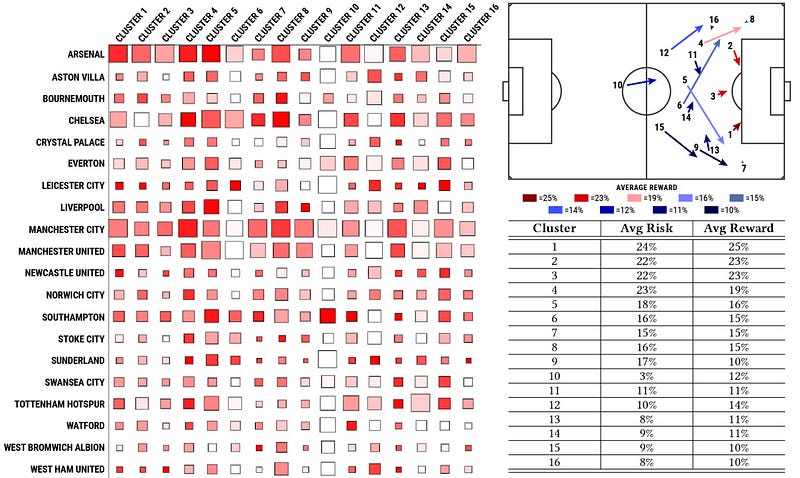
To achieve this, the authors segment the most dangerous passes, defined as those with a greater than 6% likelihood of leading to a shot, and apply k-means clustering on the XY coordinates of the pass’s origin and destination. After experimentation, it is determined that 16 clusters provide an optimal amount of information without overwhelming the analysis. Figure 11 illustrates the 16 cluster centroids, with the color indicating the average reward.
Analyzing the results, it becomes evident that the most dangerous passes occur around the edge of the penalty area (clusters 1, 2, and 3). These passes offer high rewards but also carry the highest risk, requiring exceptional skill. Interestingly, when examining the centroids, it is observed that the average position of pass types is not symmetrical, with some clusters, such as cluster 4, being more dangerous than others, like cluster 9 (19% vs. 10%). Furthermore, it is noted that the least risky pass (cluster 10) has an average risk of 3% but a higher average reward of 12% compared to six other clusters. For less skilled teams, passes from clusters 8, 10, and 16 may present better options as they have lower risk but still offer relatively high rewards.
Figure 11 provides a visualization of the passing tendencies of all teams in the league using a Hinton diagram. Each column is standardized to the league, with the size of the square indicating the number of passes made by a team, and the intensity of the color representing the team’s average danger level when using those passes. Teams such as Manchester City and Arsenal, with consistently larger squares, are seen to dominate possession. However, it is also possible to assess if teams effectively utilize their possession. For example, Arsenal has the most passes in clusters 2 and 3, but Leicester City (Cluster 2) and West Ham United (Cluster 3) are more dangerous. Analyzing Leicester City in more detail, it is revealed that they effectively combine high-risk, high-reward passes (Clusters 1 and 2) with low-risk, medium-reward passes (Clusters 6 and 12).
This team-based analysis breakthrough allows coaches to quickly identify how an opponent plays and where they pose the greatest danger. By understanding the passing patterns and danger zones of opposing teams, coaches can devise effective strategies and tactics to counter their strengths and exploit their weaknesses.
Summary
In conclusion, the authors have introduced an objective method for estimating the risk and reward associated with passes using a supervised learning approach. By incorporating contextual features, they have demonstrated improved prediction performance and the ability to provide semantic information for each pass.
The paper then proceeds to showcase four applications that demonstrate the practical utility of the proposed method. These applications cover various aspects of match and play analysis, as well as player and team analysis. The framework enables a comprehensive description of offensive behavior, defensive behavior, and overall team dynamics.
The first application focuses on individual match and play analysis. The authors illustrate how the proposed framework allows for the evaluation and comparison of individual players’ passing performances, highlighting their ability to execute high-risk passes and create scoring opportunities.
The second application pertains to player analysis. By quantifying the impact of players receiving passes and their ability to add value to the team’s passing game, the framework provides insights into the effectiveness and contribution of individual players in maintaining possession and creating dangerous opportunities.
The third application extends the analysis to include the assessment of the danger posed by passes. By measuring the likelihood of a shot being created in the next 10 seconds, the framework enables the ranking of passes based on their potential to create scoring opportunities. This information is crucial in understanding the offensive capabilities of players and teams.
The final application focuses on team analysis. By clustering and visualizing the passing patterns of teams, the framework allows coaches to identify common patterns, assess their level of danger, and gain insights into the overall passing style and effectiveness of teams.
Overall, the presented framework provides a comprehensive and objective approach to analyze passing behavior in football. It not only enables a detailed description of offensive and defensive behaviors but also facilitates the evaluation of individual players and teams. The applications showcased in the paper demonstrate the practical value of the proposed method and its potential for enhancing match analysis and decision-making processes in football.
References
Power, P., Ruiz, H., Wei, X., & Lucey, P. (2017, August). Not all passes are created equal: Objectively measuring the risk and reward of passes in soccer from tracking data. In Proceedings of the 23rd ACM SIGKDD international conference on knowledge discovery and data mining (pp. 1605–1613). https://mirkwood.cs.edinboro.edu/~bennett/class/csci480/fall2017/notes/p1605.pdf
Some of the references provided in the Related Work are not displayed here due to format limitations. However, they can be accessed through the original paper.